Introduction
Genetic diversity in wheat is essential for successful genetic improvement breeding programs and the creation of new genotypes. The success of a breeding program depends on the genetic variability of quantitative traits present in the plant material. The influence of such traits on wheat fertility is a frequent subject of analysis (Aharizad et al.,2012; Alemu et al.,2018; Pasandi et al.,2015). Negative correlations in yield components are one of the main barriers to increasing wheat yield (Slafer et al.,2014; Zecevic et al.,2010). In wheat hybrids with distant species, these unfavorable correlations can be eliminated. Aegilops species, which are closely related to wheat, can be a source not only of useful qualitative traits (Prażak & Krzepiłko,2018; Prażak & Molas,2017) and resistance traits (Coriton et al.,2009; Marais et al.,2005) but of productivity traits as well (Pilch,1996,1997). The assessment of phenotypic variation in wheat hybrid genotypes to identify groups with similar forms is an important element of the study of diversity in breeding material (Franco et al.,2001). Cluster analysis can be used to identify genotypes that can be divided into major groups based on similarity indicators. This information is essential in choosing forms in the selection process (Aharizad et al.,2012; Alemu et al.,2018; Pasandi et al.,2015).
The goals of this study were to evaluate the variability and correlations of some quantitative traits of hybrid lines of Aegilops kotschyi Boiss. and A. variabilis Eig. with winter wheat Triticum aestivum L. and their parental forms. Additionally, this evaluation was conducted to select forms that could be used as starting material in wheat breeding programs.
Material and Methods
The research material consisted of 16 hybrid lines of A. kotschyi Boiss. and A. variabilis Eig. with the common wheat T. aestivum L. and their parental components (Table 1). Aegilops species were obtained from the collection of the Leibniz Institute of Plant Genetics and Crop Plant Research (IPK) in Gatersleben, Germany. The research was conducted in 2012–2014. The plants for the study came from an unreplicated field experiment at the Experimental Station of the Faculty of Agricultural Sciences in Zamość, University of Life Sciences in Lublin (50°42′36.7″ N, 23°12′47.3″ E), Poland. In the early stages of breeding, there were a large number of lines to choose from, but a small number of seeds. For this reason, the standard method, but without replications, was used (Węgrzyn,2001). The hybrid lines were compared with the parental forms. The experimental field was located on brown soil of loess origin, classified as a good wheat complex, Valuation Class 2. The seeds of genotypes were sown on September 26, 2011, September 21, 2012, and September 26, 2013 in separate plots with an area of 2 m2 at 20 × 10-cm spacing (100 seeds per plot). During the growing season, basic agrotechnical treatments were performed and NPK fertilization was applied at 60–90–90 kg ha−1. Information on weather conditions (Table 2) was obtained from the Meteorological Station in Zamość, Płoskie 1 (50°42′36.7″ N, 23°12′47.3″ E).
Table 1
Derivation of hybrid lines of Aegilops kotschyi Boiss. and A. variabilis Eig. with Triticum aestivum L.
Table 2
Rainfall and temperature according to the Meteorological Station in Zamość.
Plants were harvested from the field at full maturity at the beginning of August, and the following parameters were determined for 10 plants from each form: number of productive tillers (NPT), length of main tiller (LMT), diameter of basal stem (second internode from the bottom of the plant; DBS), length of spike rachis (LSR), main spike density (number of spikelets per 10 cm of the spike rachis; MSD), fertility of main spike (number of kernels per spikelet; FMS), and 1,000-grain weight (TGW). The arithmetic mean, minimum, and maximum values of the traits were calculated, as well as the coefficients of variation (CV) and phenotypic correlations. To determine the differences between individual traits, a single classification analysis of variance was performed. Tukey’s multiple range testwas used (Ansari & Bradley,1960). A dendrogram was created using the unweighted pair group method with arithmetic mean (UPGMA) method using STATISTICA 12 software (Sokal & Rohlf,1962).
Results
Climatic conditions in the years 2012–2014 were varied (Table 2). Considerable variation was observed in the analyzed traits among the lines (Table 3). In the years 2012 and 2013, in the period from April to July, there was a rainfall shortage of 60% and 30%, respectively, relative to the long-term average, whereas in 2014, the total precipitation exceeded the long-term average by 3%. During all research years, the average monthly air temperature in the period from April to July was higher than the long-term average by 5.5 °C (2012) and 6.6 °C (2013 and 2014). Atmospheric conditions may have affected the productivity traits of the genotypes. The highest average rachis length, fertility, and 1,000-grain weight occurred in 2014 when the total precipitation in April–July was the highest over the 3-year study period (Table 4). The number of tillers and their length were affected by the conditions prevailing in fall. The warm fall in 2011 and 2012 enabled the emergence of plants and productive tillering. The larger number of tillers restricted access to light, which increased their elongation. The tillers were longer, but the spikes were shorter because more assimilates were used for the development of tillers and leaves (Reynolds et al.,2009). September and October were cold and rainy in 2013, which delayed sowing. The warm and humid November improved the condition of the winter crops.
Table 3
Mean values of selected productivity traits in hybrid lines of Aegilops kotschyi Boiss. and A. variabilis Eig. with Triticum aestivum L. and their parental components in 2012–2014.
Table 4
Mean, range, and variability coefficients (CV) of selected productivity traits in Aegilops L. × Triticum aestivum L. hybrid lines and their parental components – wheat cultivars and Aegilops species.
Analysis of the morphological traits of hybrid lines and parental components in 2012–2014 demonstrated that the most productive tillers were produced by the RK line (mean 24.50) among the hybrid lines and by the ‘Rusałka’ cultivar (mean 15.70) among the wheat cultivars (Table 3). The lowest NPT in the hybrid lines was 3.5 and the highest was 38.1. The range of variation in this trait was smaller in wheat – from 7.8 to 23.0 (Table 4). In the hybrid lines, the mean length of the main tiller ranged from 62.1 to 121.0 cm, whereas the range in wheat was 72.4 to 111.9 cm (Table 4). The shortest main tillers were noted in the wild species A. kotschyi Boiss. (mean 33.41 cm) and A. variabilis Eig. (mean 49.89 cm) and in lines RK (mean 68.70 cm) and KRBP (mean 70.73 cm). Among the wheat cultivars, the shortest tillers were produced by the ‘Rusałka’ cultivar (mean 75.03 cm). The KRBP line also had the densest spikes (mean 25.35) (Table 3).
In the hybrid lines, the average density of the main spike ranged from 12.4 to 26.3, whereas in the wheat cultivars it ranged from 17.0 to 26.2 (Table 4). The mean basal stem diameter ranged from 2.5 to 4.3 mm in the hybrid lines and from 3.2 to 4.3 mm in the wheat cultivars (Table 4). Significant differences were noted in the diameter of the basal stem between some of the hybrid lines and wheat cultivars. The greatest basal stem diameter was noted in the KRBT line (0.41 cm) and ‘Turnia’ wheat (0.40 cm). The remaining hybrid lines had similar, or somewhat lower values (lines KR and RK), for this trait as the wheat cultivars. The KRBT line also had the longest rachises (mean 11.8 cm). Among the wheat cultivars, only ‘Turnia’ had similar rachises (mean 11.4 cm) (Table 3, Figure 1, Figure 2). In the hybrid lines, the mean length of the rachis ranged from 7.0 to 13.0 cm, and in wheat from 7.0 to 12.0 cm (Table 4, Figure 1–Figure 3). KRBS was the most fertile of the hybrid lines during the study period (mean 2.64) and ‘Zyta’ was the most fertile of the wheat cultivars (2.82) (Table 3). The mean fertility of the main spike ranged from 0.3 to 3.1 in the hybrid lines and from 1.5 to 3.1 in the wheat cultivars (Table 4).
Figure 1
Spikes of Aegilops kotschyi Boiss. × T. aestivum L. hybrid lines and their parental components (from left): First row from top – hybrid lines (KRG, KRKo, KRMo, KRMu, KRP, KRS, KRT, KRT, and KRZ), second row from the top – A. kotschyi Boiss., ‘Gama,’ ‘Korweta,’ ‘Monopol,’ ‘Muza,’ ‘Piko,’ ‘Smuga,’ ‘Turnia,’ and ‘Zyta.’
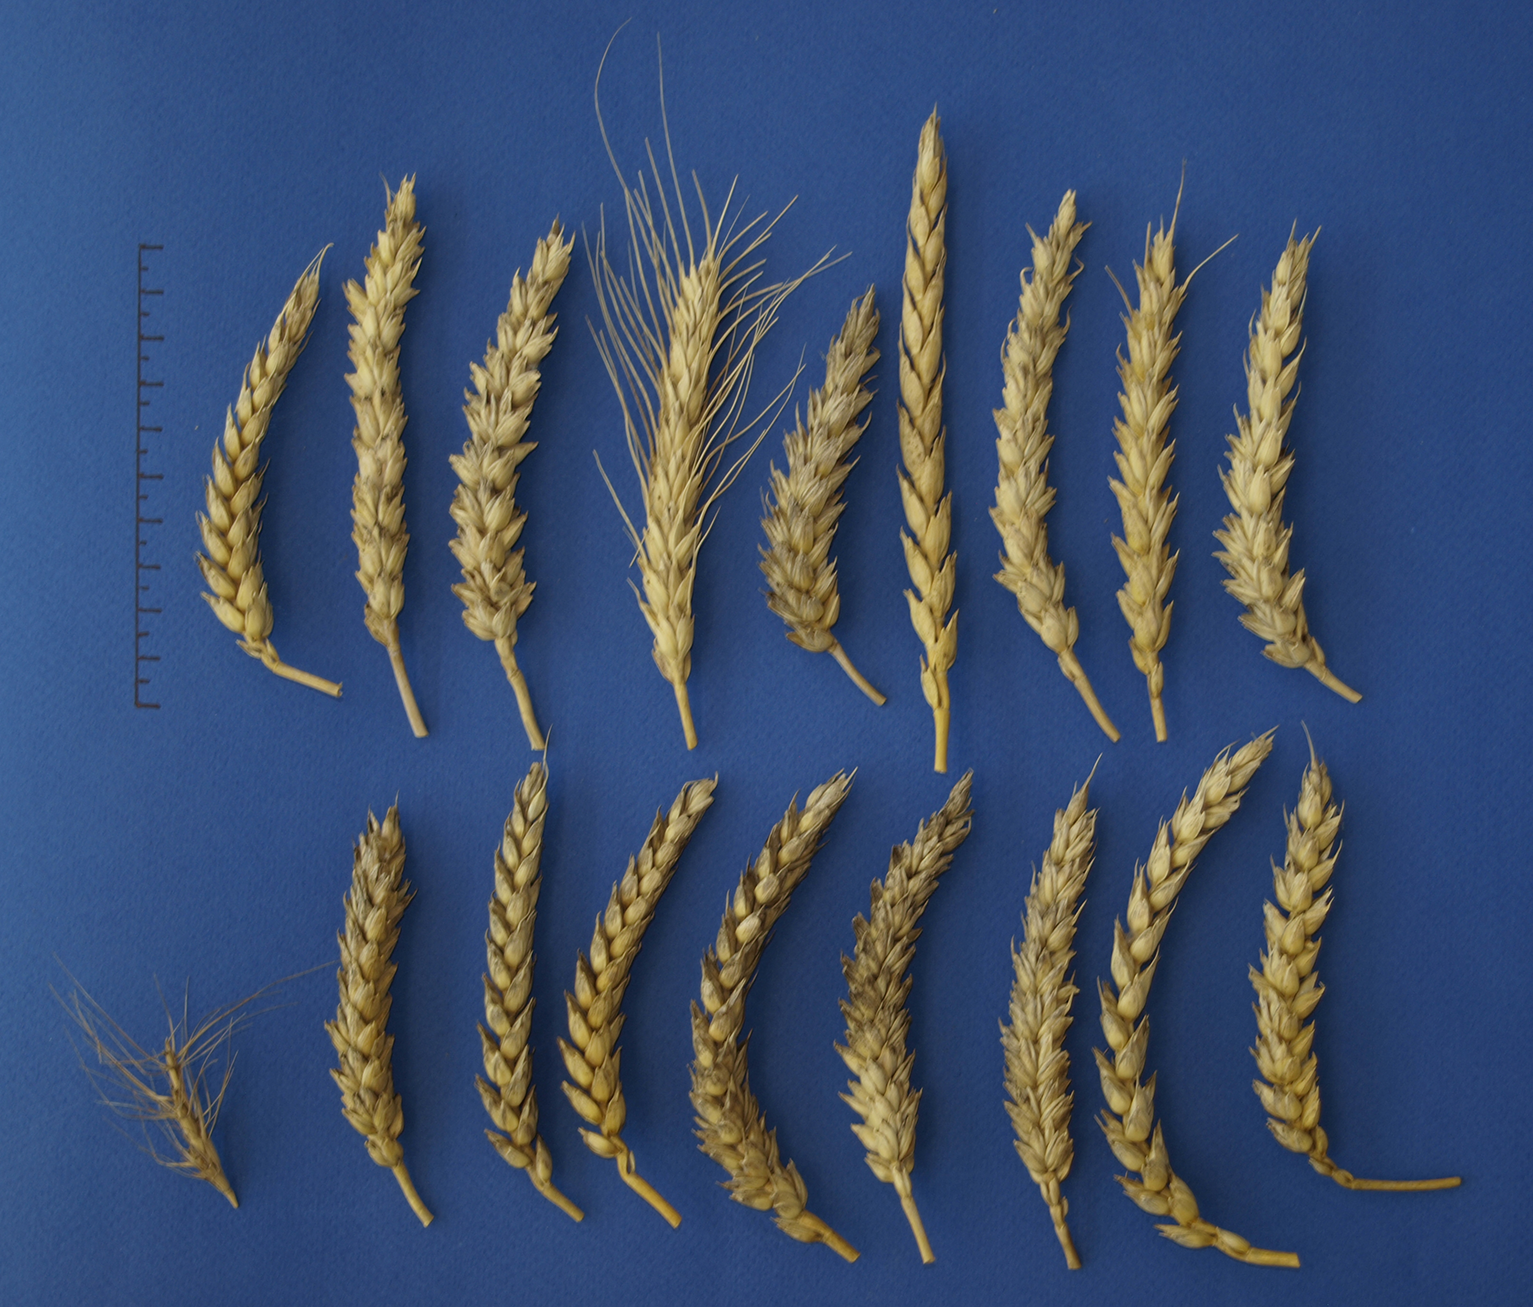
Figure 2
Spikes of Aegilops kotschyi Boiss. × T. aestivum L. hybrid lines and their parental components (from left): 1–4 – hybrid lines (KRB, KRBP, KRBS, and KRBT), A. kotschyi Boiss., ‘Rusałka,’ ‘Begra,’ ‘Piko,’ ‘Smuga,’ and ‘Turnia.’
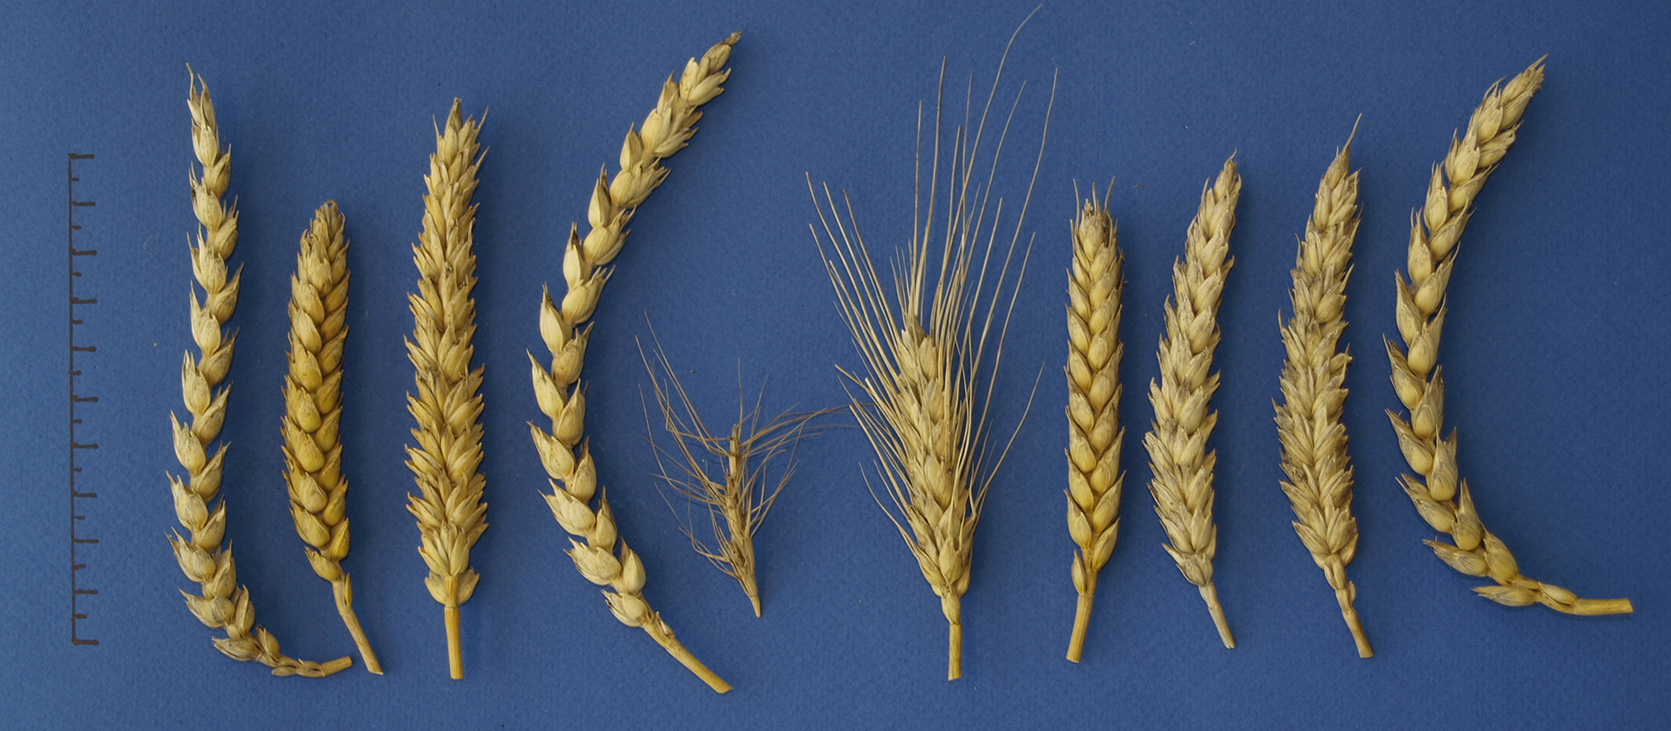
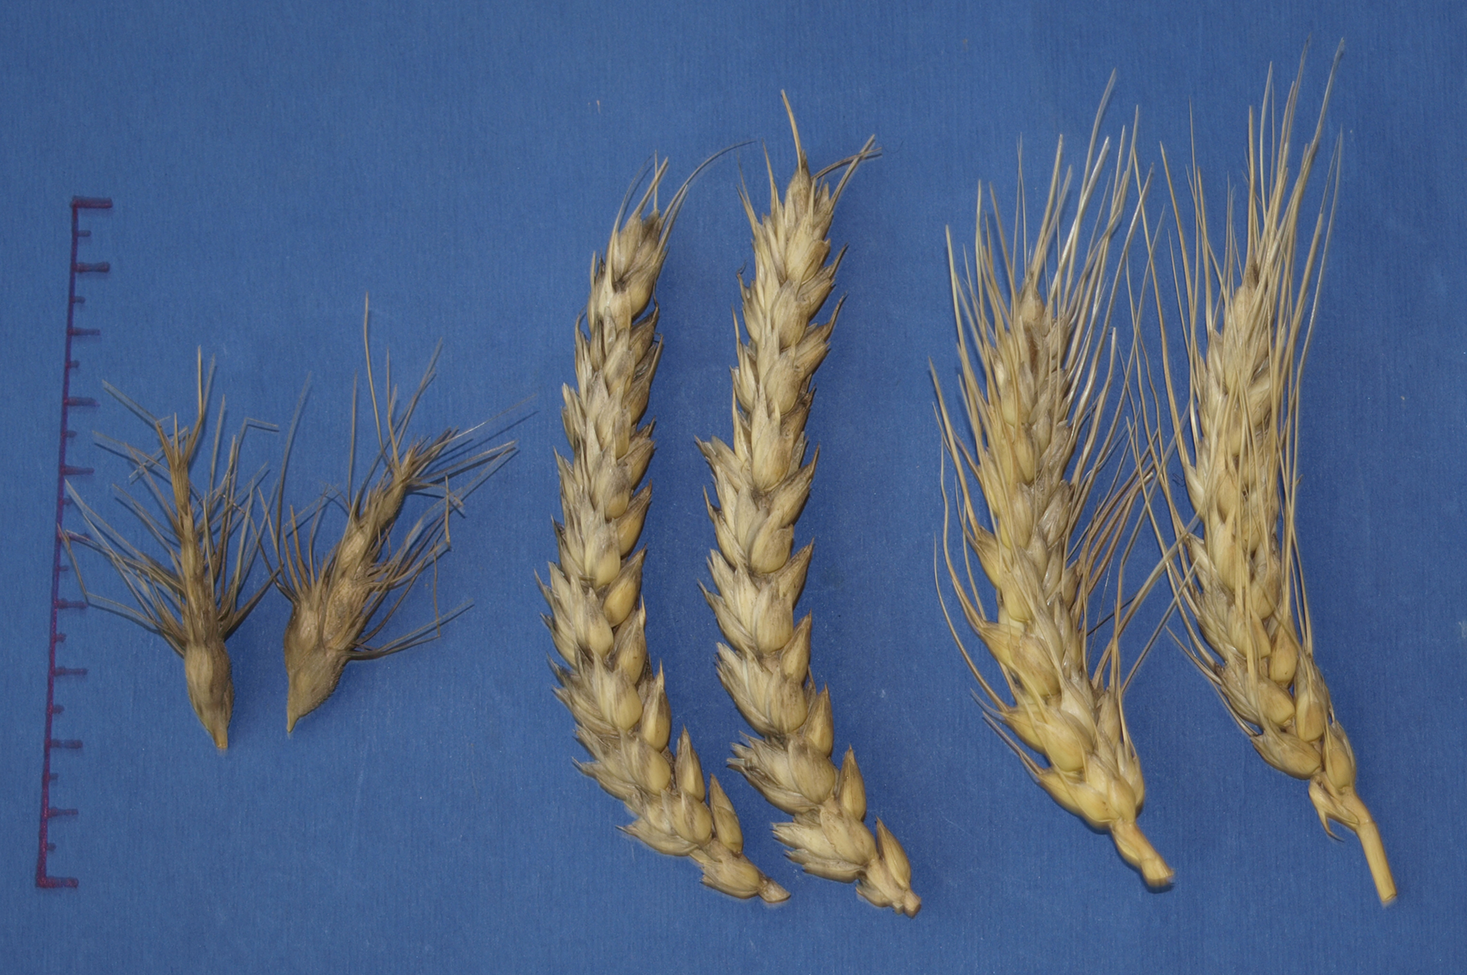
Figure 3
Spikes (from left): Aegilops variabilis Eig., VR – A.variabilis Eig. × ‘Rusałka,’ ‘Rusałka.’
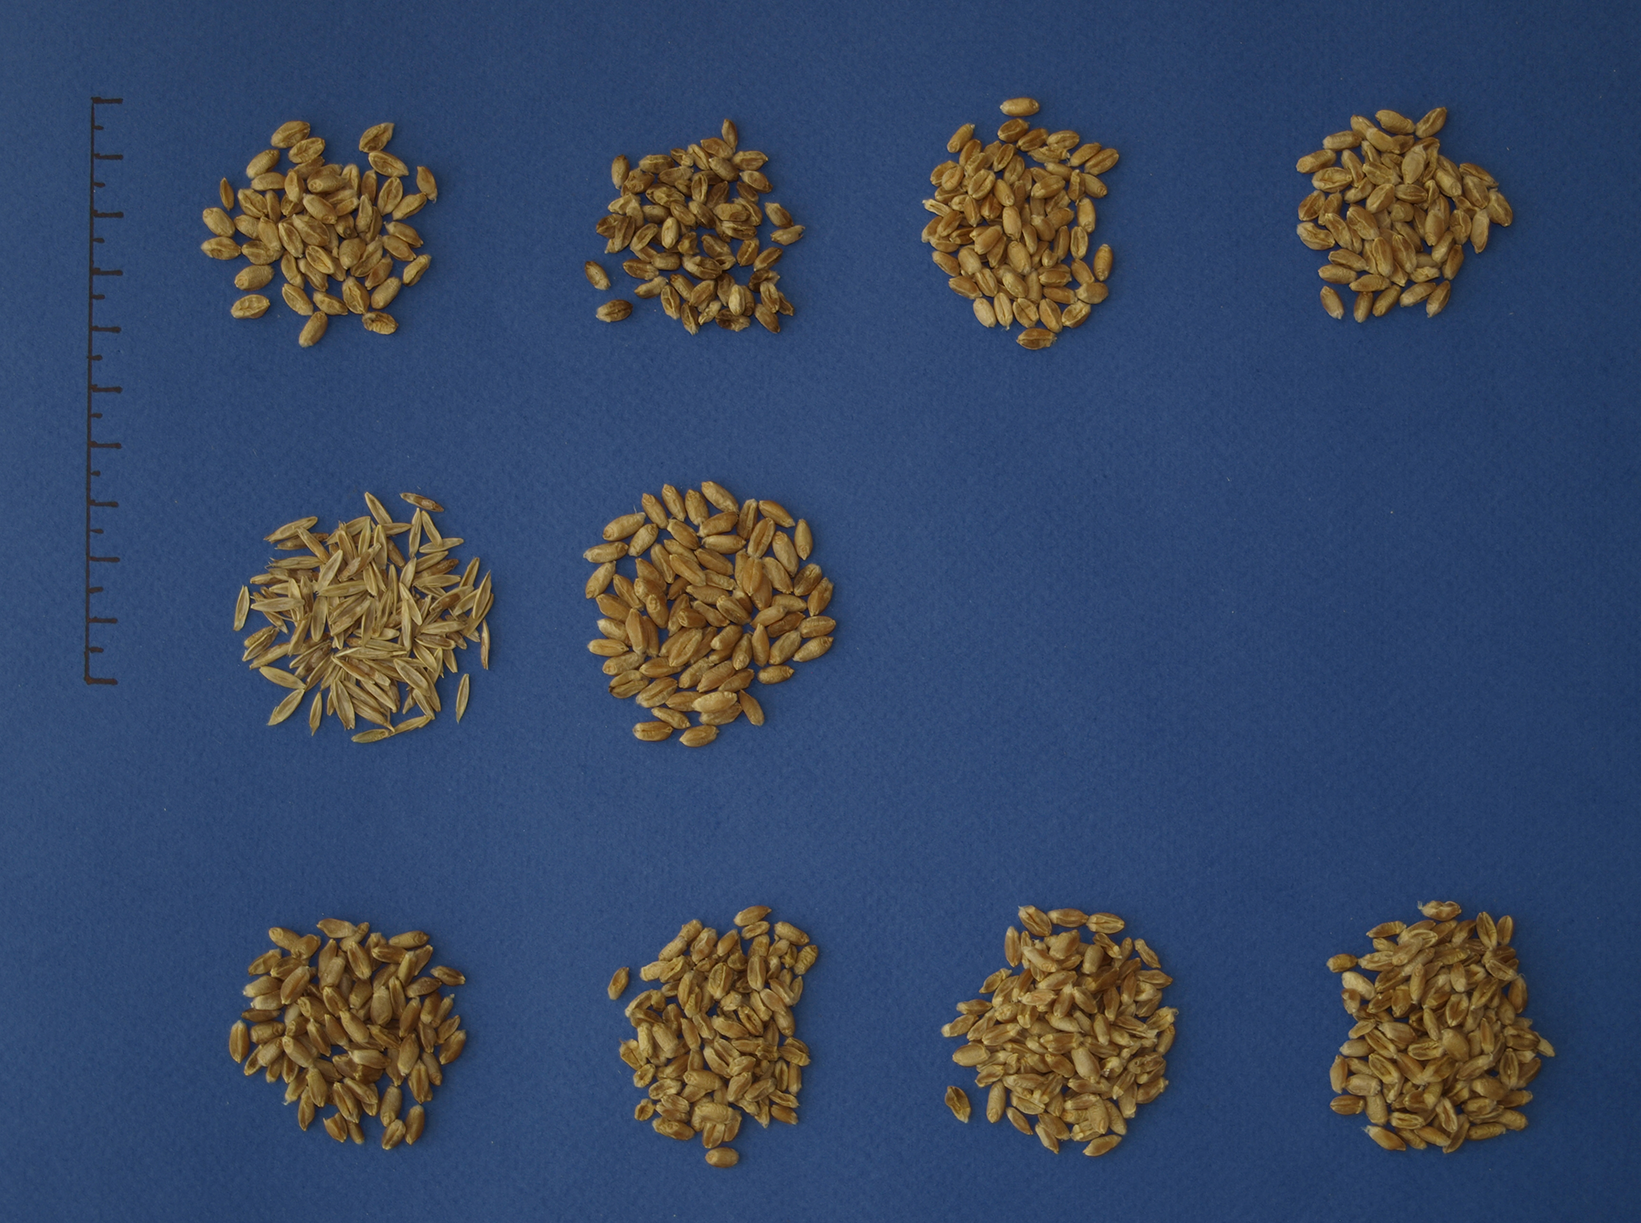
The grains of the hybrid lines were well filled and were similar to the grains of wheat cultivars in shape and color (Figure 4–Figure 6). The 1,000-grain weight in most of the hybrid lines did not differ significantly from that of the parent wheat cultivars. The highest 1,000-grain weight among the hybrid lines occurred for RV (40.52 g) and KRBT (38.47 g), and among the wheat cultivars, for ‘Rusałka’ (43.64 g) and ‘Begra’ (38.71 g) (Table 3). In the hybrid lines, the mean 1,000-grain weight ranged from 22.9 to 49.6 g and in the wheat cultivars, from 26.7 to 50.2 g (Table 4).
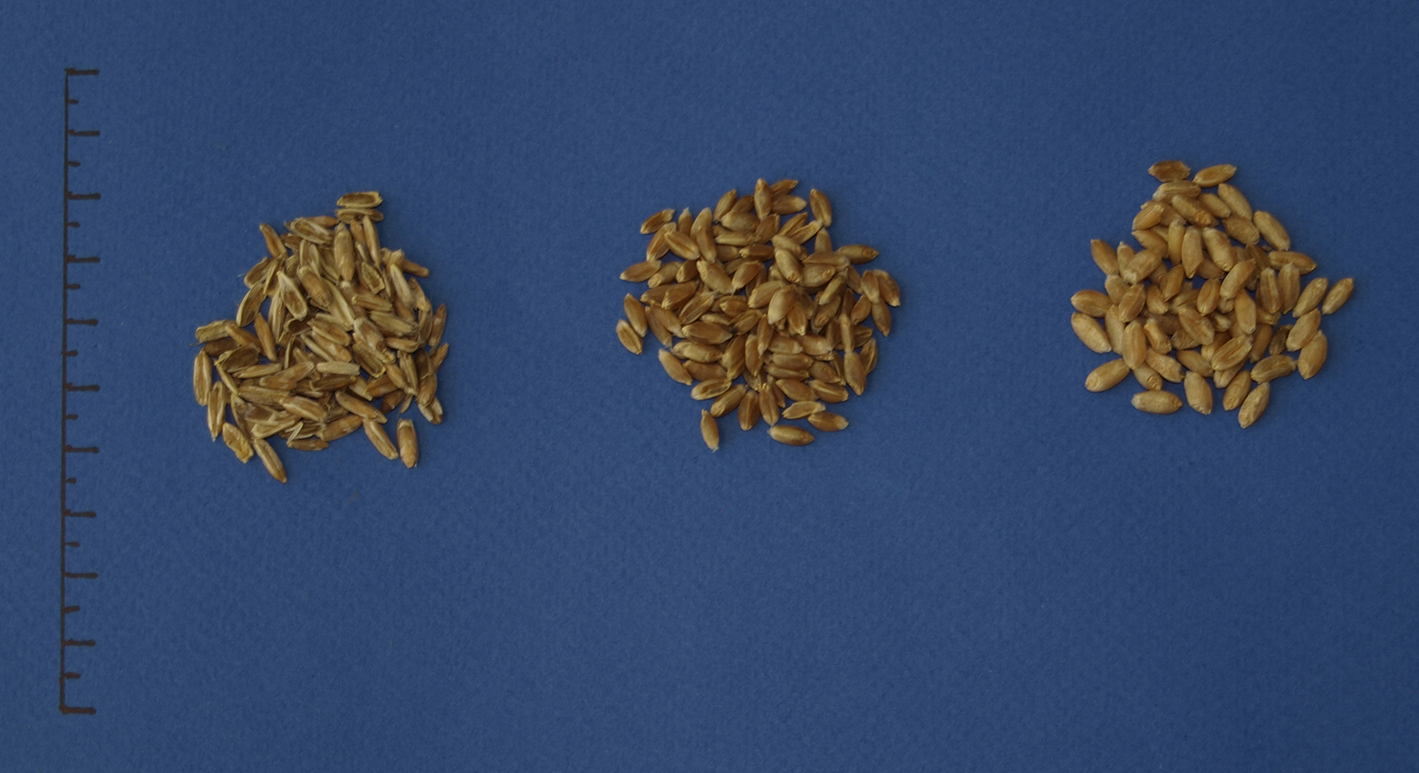
Figure 5
Grains of Aegilops kotschyi Boiss. × T. aestivum L. hybrid lines and their parental components (from left): First and second rows from top – hybrid lines (KRG, KRKo, KRMo, KRMu, KRP, KRS, KRT, KRT, and KRZ), third row from top – A. kotschyi Boiss., ‘Rusałka,’ ‘Gama,’ ‘Korweta,’ ‘Monopol,’ and ‘Muza,’ and fourth row from top – ‘Piko,’ ‘Smuga,’ ‘Turnia,’ and ‘Zyta.’
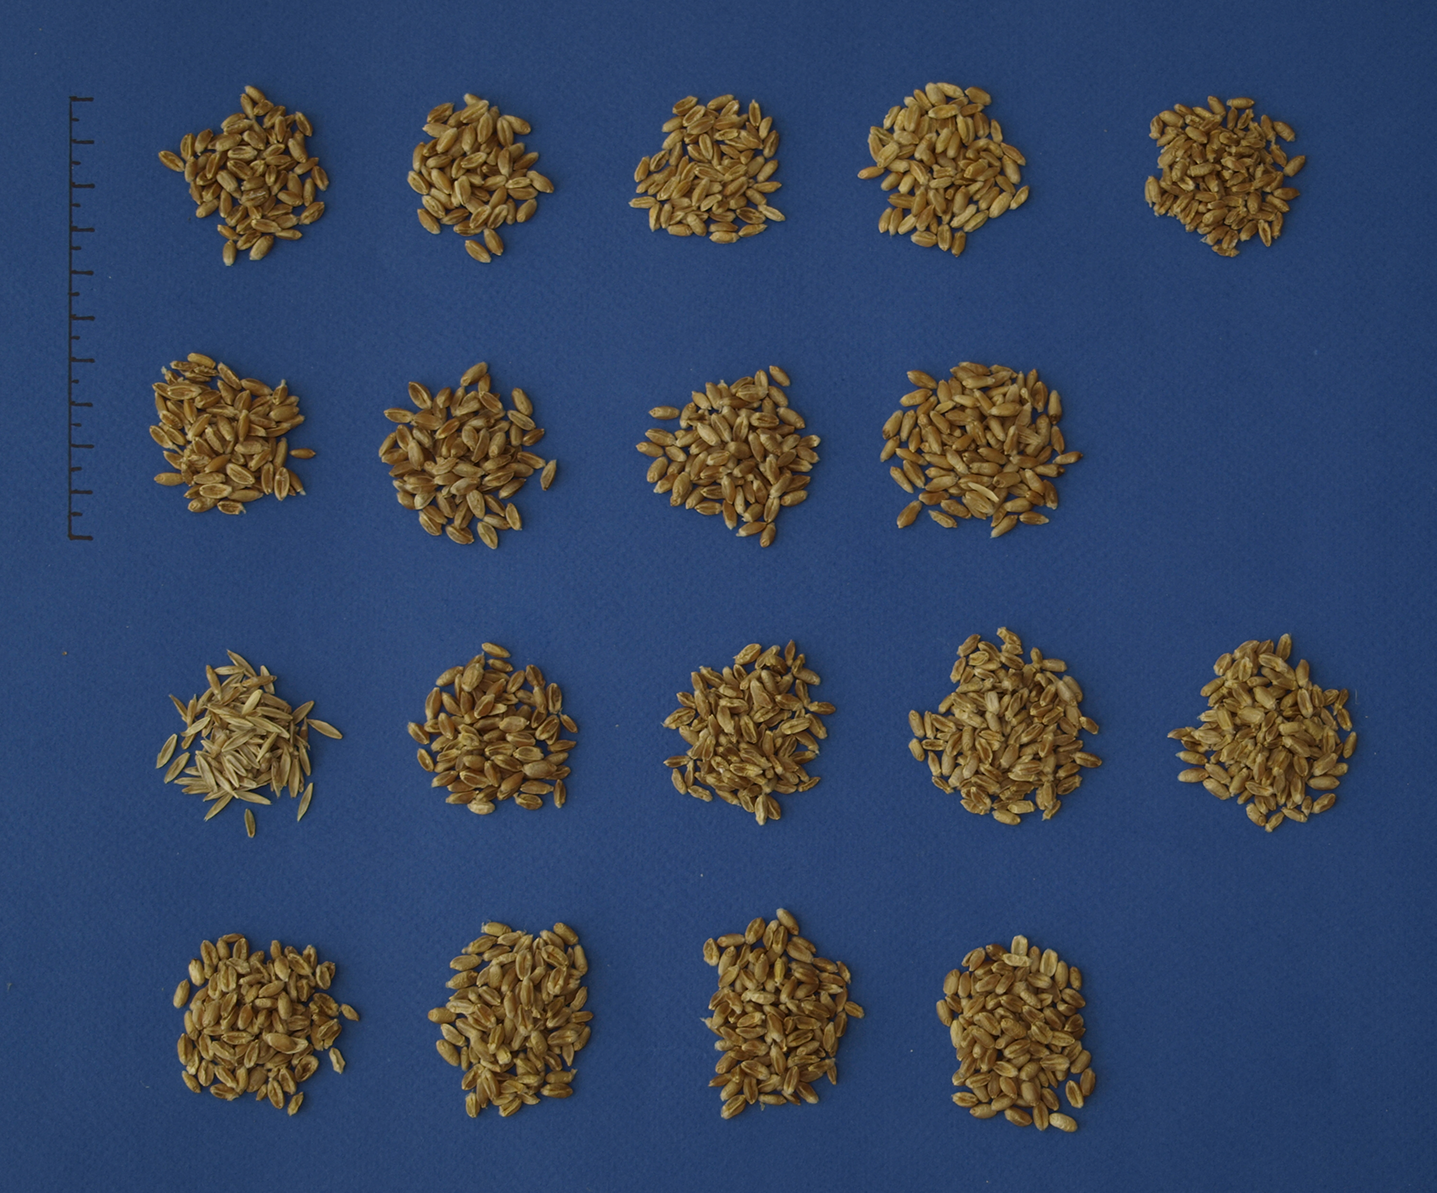
Figure 6
Grains of Aegilops kotschyi Boiss. × T. aestivum L. hybrid lines and their parental components (from left): First row from top – hybrid lines (KRB, KRBP, KRBS, and KRBT), second row from top – A. kotschyi Boiss. and ‘Rusałka,’ third row from top – A. kotschyi Boiss. and ‘Rusałka,’ and fourth row from top – ‘Begra,’ ‘Piko,’ ‘Smuga,’ and ‘Turnia.’
The highest values for rachis length, fertility, and 1,000-grain weight in the forms were noted in 2014 when the total rainfall was the highest over the 3-year study period (Table 2, Table 4). The CV of the NPT ranged from 0.3 to 0.4 for the hybrid lines, from 0.2 to 0.4 for wheat, and from 0.4 to 0.7 for Aegilops. In the case of fertility, the CV ranged from 0.2 to 0.4 for the hybrid lines, from 0.1 to 0.3 for the wheat cultivars, and from 0.4 to 0.5 for the wild Aegilops species (Table 4). In the hybrid lines, the NPT was negatively correlated with the diameter of the second internode from the bottom, rachis length, the fertility of the main spike, and 1,000-grain weight. Similar negative correlations were noted for the wheat cultivars. Only in the case of spike density was there a positive correlation (Table 5).
In Aegilops L., there was a positive correlation between the NPT and the length of the main tiller (r = 0.541). In the hybrid lines, the length of the main tiller was positively correlated with the diameter of the second internode from the bottom, length of the rachis, main spike density, main spike fertility, and 1,000-grain weight. In wheat, on the other hand, the length of the main tiller was negatively correlated with fertility and 1,000-grain weight (Table 5). In the hybrid lines, positive correlations were noted between the diameter of the second internode from the bottom and rachis length, main spike fertility, and 1,000-grain weight. In the wheat cultivars, on the other hand, there was a negative correlation between the diameter of the second internode from the bottom and 1,000-grain weight. In addition, in the hybrid lines and wheat cultivars, rachis length was negatively correlated with main spike density and 1,000-grain weight (only in wheat cultivars) and positively correlated with fertility. There was a negative correlation between spike density and fertility in the wheat cultivars and between spike density and 1,000-grain weight in the hybrid lines. In the hybrid lines and the wheat cultivars, fertility was positively correlated with rachis length and 1,000-grain weight (Table 5).
Table 5
Significant values of correlation coefficients of quantitative traits in Aegilops L. × Triticum aestivum L. hybrid lines and their parental components – wheat cultivars and Aegilops species in 2012–2014.
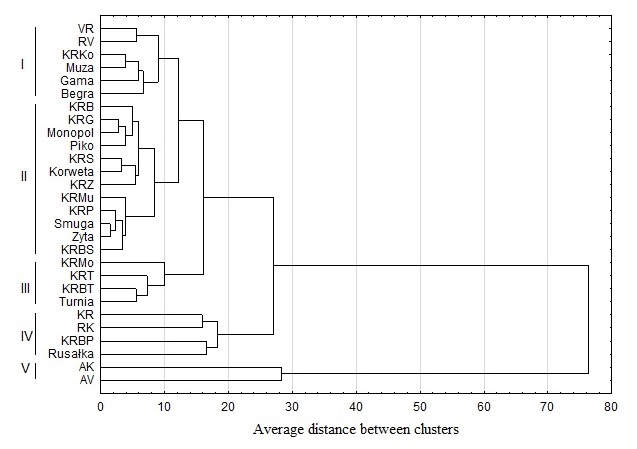
The results of the grouping of objects with similar productivity traits are presented in the form of a dendrogram (Figure 7). Cluster analysis was performed by the UPGMA method based on the Euclidean distance squared. Five homogeneous groups were distinguished. The first group and first subgroup included the VR and RV lines, characterized by high fertility and 1,000-grain weight but lower values for the remaining traits. The first group and second subgroup contained line KRKo and the ‘Muza,’ ‘Gama,’ and ‘Begra’ wheat cultivars, which were also highly fertile and had high 1,000-grain weight, but intermediate values for the remaining traits. The second group and first subgroup included the KRB, KRG, KRS, and KRZ lines and the ‘Monopol,’ ‘Piko,’ and ‘Korweta’ cultivars, with intermediate values for the analyzed traits. The second group and second subgroup contained KRP, KRMu, and KRBS and the cultivars ‘Smuga’ and ‘Zyta,’ with fewer productive tillers, long productive tillers, and intermediate values for the remaining traits. The third cluster consisted of lines KRT and KRBT and the ‘Turnia’ cultivar, with fewer productive tillers, loose spikes, and high values for the remaining traits. The third cluster also contained line KRMo, which was distinguished from the other forms in this group by its short rachises, highest spike density, low fertility, and low 1,000-grain weight. The fourth cluster and first subgroup included lines KR and RK, with the most productive tillers of all the lines, short productive tillers, intermediate rachis length, and low values for the remaining features. The fourth cluster and second subgroup consisted of line KRBP and the ‘Rusałka’ cultivar, with fewer productive tillers, short productive tillers and rachises, and intermediate basal stem diameter and spike density. In contrast with ‘Rusałka’ wheat, the KRBP line had low fertility and 1,000-grain weight. The fifth cluster contained the wild species A. kotschyi Boiss. and A. variabilis Eig., which had the most productive tillers, intermediate fertility, and the lowest values for the remaining features.
Discussion
The large variation observed between the lines was because of their hybridity and the effects of environmental conditions (Morris,2009). Climatic conditions may have influenced the value of productivity traits. Hybrid lines each year showed greater variation in productivity traits, such as the number and diameter of productive tillers, rachis length, and fertility than did their parent wheat cultivars. However, the greatest variation in these features was noted in wild Aegilops species. Naghavi et al. (2014,2015) also reported that elements of wheat yield structure are dependent on weather conditions during the growing period. Many experiments have demonstrated a relationship between the elements of crop structure and weather conditions during the growing season (Brzozowska et al.,2008; Buraczyńska & Ceglarek,2008; Głowacka,2010; Woźniak,2006).
Tillering in most of the hybrid lines was similar to that of wheat. The NPT in the hybrid lines and wheat cultivars was significantly lower than the NPT in the wild Aegilops species. In a study by Loureiro et al. (2007), tillering in hybrids of wheat with Aegilops L. species was similar to wheat tillering.
The shortest main tillers were noted in the Aegilops species (less than 50 cm), the lines RK and KRBP (about 70 cm), and the ‘Rusałka’ wheat cultivar (mean 75.03 cm). Short-straw wheat cultivars usually have thicker tillers and are more resistant to lodging. The KRBP line also had the densest spikes (mean 25.35). Tyrka and Stefanowska (2001) found that the length of the main tiller in wheat hybrids with A. juvenalis (Thell.) Eig. and A. ventricosa Tausch ranged from 44.4 to 118.8 cm. In a study by Knott and Dvořák (1981), the length of the main tillers in hybrid lines of A. speltoides Tausch. × T. aestivum L. ranged from 70.0 to 96.4 cm. Wheat cultivars with high spike density often have small kernels, whereas loose spike density is associated with plump kernels. However, they were more resistant to seed shedding than forms with loose spikes. Wheat forms with loose spikes have less than 17 spikelets per 10 cm of rachis, whereas forms with spikes of average density have 17–22 spikelets, and forms with dense spikes have 23 or more spikelets. In the hybrid lines, the average density of the main spike and basal stem diameter were similar or lower than that of the wheat cultivars, but their spikes were similar or longer.
Significant differences were noted in these traits between some of the hybrid lines and wheat cultivars. Plants with long, dense spikes and high numbers of spikelets and flowers per spikelet usually produce high yields. Hybrids of wheat with A. speltoides Tausch., A. triumvidis L., and A. squarrosa L. obtained by Pilch (1996, 1997) had longer spikes, more spikelets per spike, more grains per spike, and higher 1,000-grain weight than wheat cultivars. The fertility of the main spike in the hybrids was generally lower than that of the parent wheat cultivars. Tyrka and Stefanowska (2001) found that successive generations of wheat hybrids with A. ventricosa Tausch. and A. juvenalis (Thell.) Eig. did not differ significantly from wheat in terms of fertility. In the present study, most lines did not differ significantly in fertility from that of the wheat cultivars. Tyrka and Stefanowska (2001) reported that the 1,000-grain weight of wheat hybrids with A. ventricosa Tausch. and A. juvenalis (Thell.) Eig. ranged from 21.6 to 52.1 g, whereas that of wheat ranged from 32.6 to 42.7 g. According to the authors, the hybrid plants had a greater range of variability in 1,000-grain weight than did the winter wheat cultivars. Arain et al. (2018) noted a significant positive correlation (r = 0.683) between 1,000-grain weight and grain yield.
Apart from their dependence on environmental factors, morphological traits are subject to both natural and artificial selection. Therefore, if there is an association between the loci controlling the targeted morphological trait, the influence of environmental factors will be lower (Mollasadeghi et al.,2012). In our study, the NPT in the hybrid lines and the wheat cultivars showed low negative correlations with most of the analyzed traits. The length of the main tiller was positively correlated with most of the traits in the hybrid lines but negatively correlated with those in the wheat cultivars. A similar negative correlation for the length of the main tiller and grain yield in wheat cultivars has been reported by Naghavi et al. (2015). Kociuba (2007) noted a positive correlation between the length of the main tiller in hybrid lines of triticale and wheat and 1,000-grain weight. According to the author, this may be significant in newly introduced short-straw forms of triticale. Nowosad et al. (2018) also reported a statistically positive correlation between the length of the spike and the height of the plant (r = 0.334) in winter rye F2 hybrids.
Mandea et al. (2019) reported a strong negative correlation in wheat cultivars between the number of spikes per 1 m2 and the number of grains per spike. Naghavi and Khalili (2017) found wheat grain yield to be positively correlated with rachis length and the NPT.
The UPGMA method has been widely used for the analysis of morphological traits in plant breeding (Carović-Stanko et al.,2011; Dossou-Aminon et al.,2014; Silva et al.,2017). Cluster analysis performed by the UPGMA method distinguished five homogeneous groups. The distribution structure of the genotypes into five distinct clusters indicated considerable genetic diversity among the genotypes for most of the traits analyzed. Twenty-eight genotypes grouped into five clusters showed inter-cluster diversity. Cluster I consisted of six genotypes – three hybrid lines (VR, RV, and KRKo) and three parental wheat cultivars (‘Muza,’ ‘Gama,’ and ‘Begra’). Cluster II had the highest number of genotypes (43%) and was comprised of seven hybrid lines (KRB, KRG, KRS, KRZ, KRMu, KRP, and KRBS) and five parental forms of wheat (‘Monopol,’ ‘Piko,’ ‘Korweta,’ ‘Smuga,’ and ‘Zyta’). Cluster III was formed by three hybrid lines (KRMo, KRT, and KRBT) and a single wheat cultivar (‘Turnia’). Cluster IV was also represented by three hybrid lines (KR, RK, and KRBP) and a single wheat cultivar (‘Rusałka’). Cluster V was formed by the wild Aegilops species. UPGMA employs a sequential clustering algorithm, in which local topological relationships are inferred in order of decreasing similarity and a dendrogram is built in a stepwise manner. First, the two closest data points are identified and grouped in the dendrogram. After the first clustering, the two closest data points are treated as a single data point and new distances are computed using the average of the distances between a simple data point and the constituents of the composite data point. Then, the next closest data points are added to the dendrogram until all data points are included (Sneath & Sokal,1973; Sokal & Rohlf,1962).
Cluster analysis for various productivity traits provided more information about the genetic diversity among hybrid lines and their parental components. The selection of hybrid lines for higher grain yield based on these traits could be useful for further breeding.
Conclusions
The evaluated hybrid lines had a greater diversity of productivity traits than the wheat parental components and could be valuable starting material in wheat breeding. Particularly noteworthy are the lines KRBP, with the shortest tillers, and KRBT, with the greatest basal stem diameter, longest spikes, and a high 1,000-grain weight. In the hybrid lines, the main tiller length and basal stem diameter were positively correlated with fertility and 1,000-grain weight. In contrast, wheat showed negative correlations between these quantitative traits. The results confirm that wide hybrids can be used to eliminate the negative correlations between these traits in wheat to increase its fertility. The results of the research will facilitate the selection of appropriate genotypes for further breeding work.
