. Introduction
Phosphorus (P) is a very important nutrient for plants placed after nitrogen (N) and a restriction factor (Balemi & Negisho, 2012; Mustonen et al., 2012; Paisey & Santosa, 2023). Phosphorus is intimately engaged in numerous plant metabolic processes, and its deficiency appears to be the primary reason for low yield. Plant P absorption is frequently hampered by its very poor solubility in soil (Paramesh et al., 2014). It is a critical component of both DNA, the genetic “memory unit" of all living things, and RNA, the material that reads the DNA’s genetic code to produce proteins and other substances required for plant structure, seed production, and genetic transfer. Contrarily, P treatment promotes root proliferation, which increases root volume enhances soil nutrient exploration, and so improves crop quality (IPNI, 2011).
The deficiency of P affects about 35–40% of the World’s cultivated soil. Phosphorus becomes unavailable in the soil system as it is fixed by sesquioxides, resulting in P shortage (Saleque et al., 2004). P precipitates with Al and Fe ions in soil at pH below 5.5, but with calcium (Ca) ions at soil pH above 7. The most readily available phosphorus is found in organic soils at pH 5.5 and in mineral soils at pH 6.5 (Penn & Camberato, 2019).
However, phosphorus fertilizer used more than what is needed for crops poses a significant environmental risk due to soil P accretion, which increases the possibility of P losses to surface and ground waters and causes eutrophication, which harms aquatic environments (Carpenter, 2005; Haygarth & Jarvis, 1999). Furthermore, commercially viable phosphate rock reserves are diminishing, and some scenarios, though debatable, project their depletion within the next 100 years (Gilbert, 2009). Farmers typically apply significant amounts of P fertilizer and lime to saturate Al and Fe ions and boost soil pH to decrease P fixation (Ch’ng et al., 2020). However, this approach is both inefficient and harmful to the environment, as a higher application of P fertilizers creates water contamination, e.g. eutrophication. Furthermore, the over-liming in the soil ultimately forms calcium phosphate, which is unavailable to plants. Therefore, the wide use of P in agriculture leads to several issues like drastically increasing production costs, quick depletion of nonrenewable P resources, and eutrophication of waterways. Furthermore, according to Carpenter and Bennett (2011), the P from mineral sources in soils, freshwaters, and ultimately oceans is considered to be outside the safe operating ranges in the long term. The possible concerns of the world P constraint as to peak phosphorus have recently been extensively addressed (Cordell et al., 2009; Edixhoven et al., 2014; Gilbert, 2009; Scholz & Wellmer, 2013, 2016).
The fertilization advice is typically based on soil P studies that roughly estimate how much P is accessible to plants through analysis (Demaria et al., 2005). The extent to which soil chemical extractions are successful in determining the amount of plant-available P and estimating the quantity to apply for desirable production is not a frequent practice. For example, several previous findings revealed that perennial forage grasses (Bélanger & Ziadi, 2008; Messiga et al., 2015), wheat (Bélanger et al., 2015b; Valkama et al., 2011), maize (Ziadi et al., 2014), and rapeseed (Bélanger et al., 2015a; Grant et al., 2009; McKenzie et al., 2003) were found not to respond by application, but the prediction was pragmatic depending on the chemical analysis. However, because those tests were only conducted over a brief period of time, the effects of long-term P fertilization on soil-accessible P and grain yield were not explored.
Therefore, the critical limit (CL) of P is a crucial indicator for figuring out how much fertilizer is suitable for plants. Plants show a response to P fertilizer application when the soil P status is below the critical limit. It distinguishes between a group of soils that respond to fertilizers with a considerable increase in yield and a group of soils that do not (Banerjee et al., 2009). The CL is frequently used for range-specific locations of a crop variety, but in some cases, these CL may differ for both distinct species of soil and crop but also various cultivars of the same crop (Singh & Agarawal, 2007). For various extractants, different critical values of accessible P in a given soil for mustard have been documented (Murthy, 2004). Also, these limits changed depending on the soil and the extractants utilized in that soil (Bloem et al., 2002). In the soil where the P content is low compared to the critical limit, it is crucial to define a CL for P in the soil so that the growers can continue to sustain crop production using fertilizers that include P. According to soil P studies, there was no yield variation to P fertilizer in fields where a positive response was predicted (Bélanger et al., 2015a; Grant et al., 2009; Ziadi et al., 2014).
In the current study, the two crops that are the subject of this study are mustard (Brassica napus L.) and maize (Zea mays L.), which are both grown on soils from three different AEZs with contrasting P fertilization. The goals were to (i) estimate the critical limit of P for various soils and crops and (ii) outline the current state of macro- and micronutrients in terrace soils (AEZs: 25, 26, and 27) (both maize and mustard crops). The substantial fluctuations of the P content in cultivated land caused by fertilizer application from the earlier time contrast the P application in soil that benefits sustainable soil fertility regarding P for crop growth.
. Materials and methods
. Details and locations/types
To estimate the critical limit of P for various soils and crops and to outline the current state of macro- and micronutrients in terrace soils (AEZs: 25, 26, and 27) (for both maize and mustard crops), the study was conducted in 20 types of soil using two crops (maize and mustard) both in pot and field experiments. Twenty soils from different places were used as experimental materials, among them 12 soil samples had inadequate soil fertility, 4 had low fertility, and the remaining 4 had medium levels of fertility. The treatments were two crops: BARI Hybrid Maize 7 (Maize) and BINA Sharisha 9 (Mustard) and two levels of phosphorus (P): 0 and 15 ppm.
. Soil sampling and analysis
Bangladesh still maintains thirty AEZs, which have been categorized based on the various soil properties and climatic conditions (Huq & Shoaib, 2013; Quddus, 2009; Shil et al., 2016). Three separate Agro-ecological Zones (AEZs): Level Barind Tract (AEZ-25), High Barind Tract (AEZ-26), and North Eastern Barind Tract (AEZ-27) were chosen for the study, and soil samples were taken for their intense cultivation of mustard and maize crops. The AEZ-25 is basically developed over Madhupur Clay. The predominant soils have grey, silty, puddled topsoil with a plough pan. Shallow Grey Terrace soils and Deep Grey Terrace soils are the major components of the general soil types of the area. The AEZ-26 includes the south-western part of the Barind Tract where the underlying Madhupur clay has been uplifted and cut into by deep valleys. The topsoil is grey silt loam to silty clay loam, is strongly puddled, and has a compact plough pan at the base. Deep Grey Terrace soils and Gery Valley soils are the major components of the General soil types of the area. The AEZ-27 occupies several discontinuous areas on the north-eastern margins of the Barind Tract. It stands slightly higher than the adjoining floodplain land. The region has silty or loamy topsoil and clay loams to clay subsoil and grades into strongly mottled clay. Deep Red Brown Terrace soils and Deep Grey Terrace soils are the major components of the General Soil types of the area (Huq & Shoaib, 2013; Quddus, 2009; Shil et al., 2016).
To carry out the objectives fast, all soil sample collection was done from the surface of the selected areas (Figure 1), which were located in the districts of Naogong, Chapainowabgonj, and Bogra and were within 0–15 cm depth.
Figure 1
Locations of soil samplings in three separate AEZs (i.e., Level Barind Tract (AEZ-25), High Barind Tract (AEZ-26), and North Eastern Barind Tract (AEZ-27)) of Bangladesh.
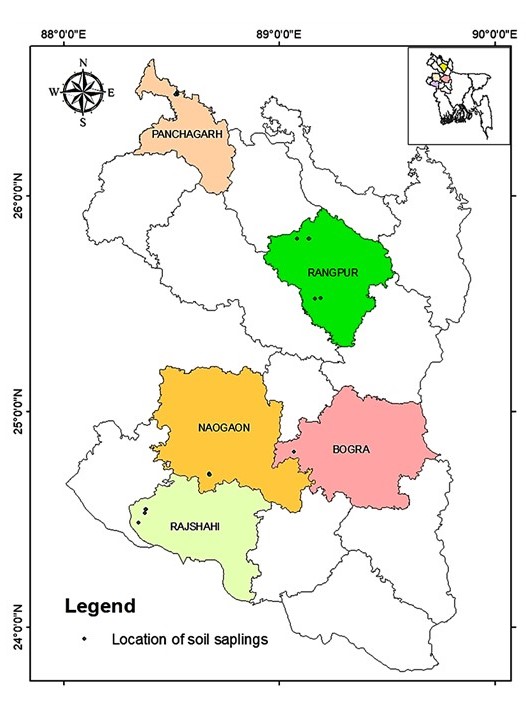
Table 1 displays the locations of the soil samples that were taken from various sites as well as general soil characteristics (Figure 1). Following accepted procedures, the soil samples were examined for texture, pH, organic matter, and other nutrients. However, twenty bulk samples were chosen for pot trials from the following locations, ranging in depth from 0 to 15 cm (Table S1, Table S2).
Table 1
Chemical characteristics of chosen soil samples with low, medium, and high phosphorus (P) levels for bulk soil collection for pot studies.
. Experimental design and approach
. Details of the pot trials
During the Rabi season 2019–20, mustard and maize were the subjects of pot trials (Figure 2). The pot experiments were undertaken considering two treatments (with and without P) that were replicated three times. The pot trials were set up during November 2019 and the mean day length and night temperature were 11 h and 22 °C, respectively. Five kilograms of soil were used in each pot for the mustard study, while 10 kg were used for the maize crop. The nutritional elements were employed at a rate of N150P35K90S25Mg6Zn2B1 kg/ha for mustard and N250P60K120S45Mg10Zn3B2 kg/ha for maize based on soil analysis.
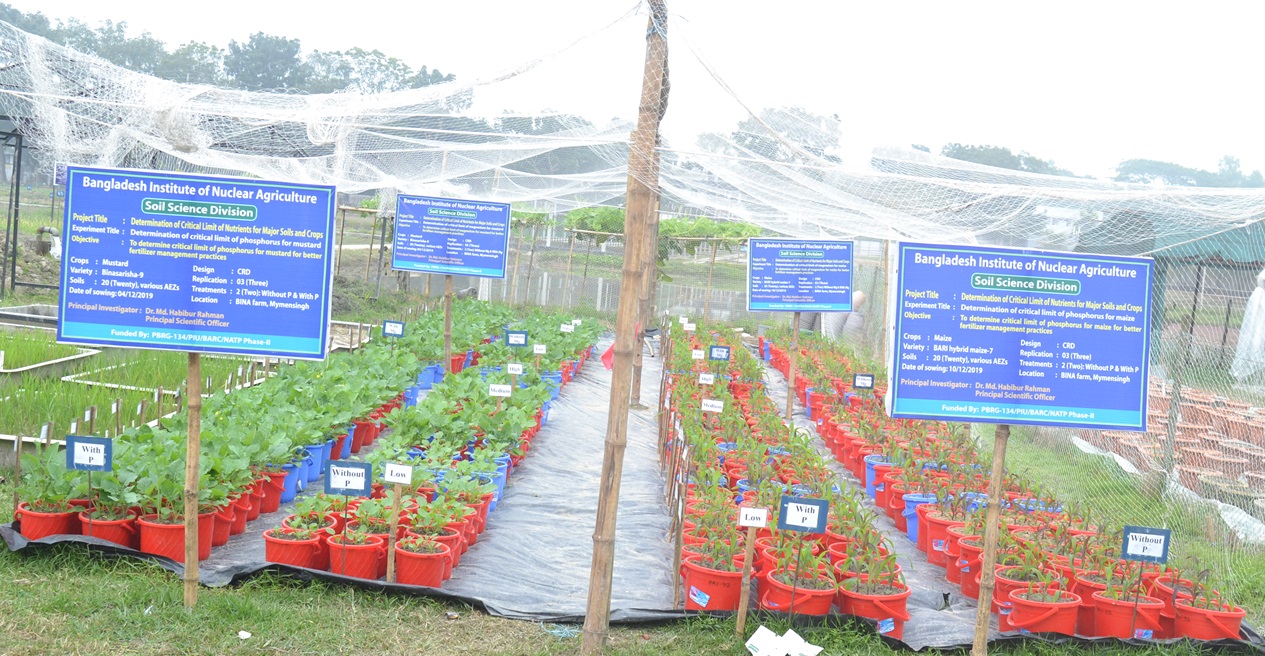
On December 4 and December 11, ten sprouted mustard seeds and six sprouted maize seeds were planted in each pot, respectively. Five mustard plants and 3 maize plants were grown. The mustard was harvested on January 15, 2020 (six weeks), and the maize was harvested on February 14, 2020 (nine weeks).
. Plant analysis
The samples were chemically tested for all elements, except for N, after being digested with HNO3–HClO4 and N using H2SO4–H2O2 (Jones & Case, 1990; Watson & Isaac, 1990).
. Determination of the critical limit
Critical limits of P were established by plotting the relative crop yield (%) on the Y axis and the soil nutrient concentration on the X axis for each crop per nutrient (1965) using the Cate and Nelson (1965) approach. Within the crop yield ratio and treatments were used to obtain the relative yield percentage, as shown below. The Y axis was shown with the average of the twenty relative yield values. On the X axis, a perpendicular line parallel to the Y axis was drawn from the intersection of the horizontal line, and the trend line on the X axis was the critical limit of the specific crop for the specific nutrient.
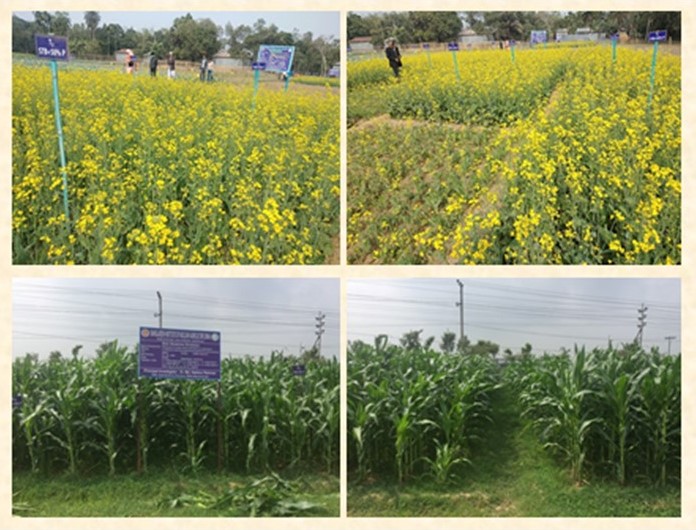
. Field validation
The experiments were conducted at farmers’ fields in Nalitabari, Sherpur for both mustard & maize crops (Figure 3). There were six treatments (T1: Control, T2: 50% STB, T3: 75% STB, T4: 100% STB, T5: 125% STB and T6: 150% STB) used and the design was the Randomized Complete Block Design (RCBD) that replicated fourth. The nutrients were used at the rate of N120P30K75S25Mg5Zn2B1.5 kg ha−1 for mustard and N220P50K100S42Mg15Zn4B2 kg ha−1 for maize.
. Analytical Statistics
The raw data gathered from the trials was examined using a factorial complete randomization design (CRD). In the case of the field trials, the Randomized Complete Block Design (RCBD) was used to analyze the data. According to Gomez and Gomez (1984), the significance of each treatment on the dry matter yield, concentration, and P absorption by mustard and maize was assessed using a two-way ANOVA on the data.
. Results
This research was limited to the soil samples that underwent physicochemical analysis (Table 1). The pH of 20 soil samples ranged from 4.6 (very strongly acidic) to 7.4 (slightly alkaline), according to the testing. The studied soil had an organic matter level ranging from 0.66% (low) to 2.33% (high). In the tested soils, the major content of soil P ranged from 3.4 to 35.5 mg kg−1. According to their P content, the soils were categorized as extremely low (5–10 mg kg−1) in 10 cases, medium (15–25 mg kg−1) in 4 cases, and high (25–30 mg kg−1) in 4 cases. The N (0.06–0.163%), K (0.056–0.14 meq%), S (5.02–32.1 mg kg−1), B (0.045–0.933), Zn (0.47–3.52), and Mg are macro and micronutrients (0.13–3.77).
. Shoot dry weight of mustard grown with and without P in the pot culture
The application of P to the soil greatly boosted the dry weight of the mustard shoots. According to Table 2, the shoot dry weight of mustard in low P soil varied from 2.02–3.06 g pot−1 without P to 2.52–3.83 g pot−1 with P addition, with a percentage relative yield of 74–92.
Table 2
Relative yield of mustard and maize with and without P.
The dry weight in the medium P soil varied from 4.05 to 4.81 g pot−1 without P and from 4.25 to 5.40 g pot−1 with P application, and the relative yield percentages ranged from 82 to 95. The dry weight in the high P soil ranged from 4.48 to 5.67 g pot−1 without P and from 4.80 to 6.95 g pot−1 with the P treatment with relative yield percentages ranging from 82 to 95. Overall, the mustard dry weight varied from 2.02 to 5.67 g pot−1 without P and from 2.52 to 6.95 g pot−1 with the P application. With a mean value of 84.1, the relative yield (%) had a range from 74 to 95.
. Critical limit of P for mustard
The critical limit of P concentration for mustard (49 DAS) was determined graphically to be 0.14%. The statistical analysis of the findings also confirmed the same CL of P concentration (0.14%, see Table S1), wherein a plant will be labeled as having insufficient P throughout the specific growth period and below this level, a plant would be regarded as P deficient and requiring the application of exogenous P during the appropriate development period.
In the current investigation, the CL of accessible P was determined to be 14.8 ppm (Figure 4), whereas the CL in FRG-2018 was 10 ppm.
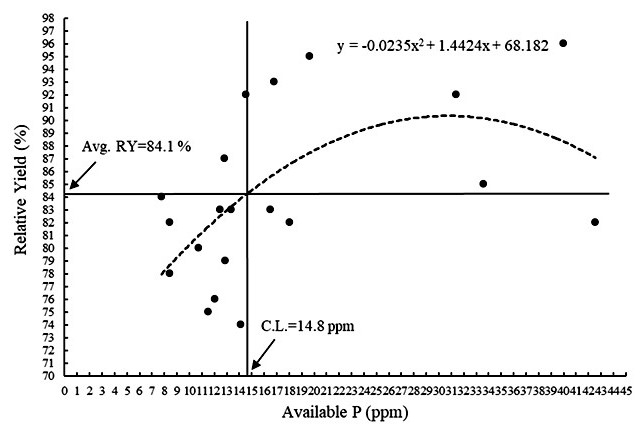
When soil P levels are less than 14.8 ppm, mustard plants should respond to P application (NaHCO3 extractable P). The CL of P in soil for mustard using a statistical technique was 18.9 ppm. It is clear from the essential levels of P in soils that P application rates below 15 mg kg−1 of soil cannot be beneficial for the crop to reduce the stress caused by P deficiency.
. Shoot dry weight of maize grown with and without P in the pot culture
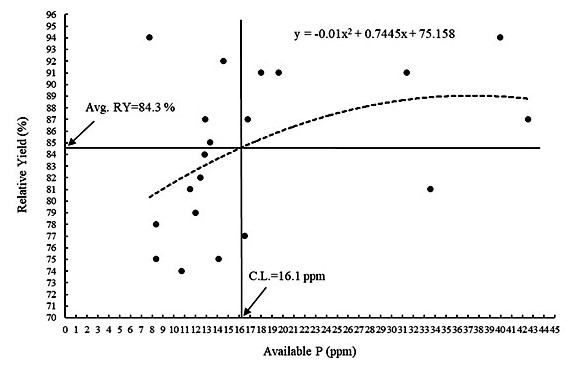
Upon the addition of the P treatment in this study, the shoot dry matter of maize greatly increased. According to Table 2, the dry matter yields in low P soil ranged from 3.3 to 5.87 g pot−1 without P and from 3.5 to 7.19 g pot−1 with the P treatment, and the relative yield percentages ranged from 74 to 94. The dry matter yields in the medium P soil varied from 6.10 to 6.83 g pot−1 without P and from 7.10 to 7.88 g pot−1 with the P application, and the relative yield percentages ranged from 77 to 91. The dry matter yields in the high P soil ranged from 7.24 to 8.75 g pot−1 without P and from 8.64 to 9.64 g pot−1 with the P treatment, and the relative yield percentages ranged from 81 to 94. Overall, the maize yields ranged from 3.33 to 8.75 g pot−1 without P fertilizer and from 3.55 to 9.64 g pot−1 when P was applied. The percent relative yield had a mean value of 84.3 with a range of 74 to 94.
. Critical limit of P for maize
The CL of available P for maize was found to be 16.1 ppm in the current experiment, compared to 10 ppm in FRG-2018 (Figure 5, Table 3). Maize plants should respond to P treatment when soil P levels are less than 16.1 ppm (NaHCO3 extractable P). The CL of P in soil for maize, as determined by statistical analysis, was 13.7 ppm. The P application rates below 15 mg/kg of soil cannot be advantageous for the crop to lessen the stress brought on by a deficit, as is evident from the essential levels of P in soils.
. Phosphorus content in pot cultured mustard & maize and their essential concentration in plants
Mustard contains phosphorus in two different amounts: with P (0.240–0.379%) and without P (0.160–0.373%). The phosphorus concentration of maize, on the other hand, varies between with P (0.166–0.321) & without P (0.053–0.350%). In general, nutritional levels rise when P is applied as opposed to when it is not (Table 4).
Table 4
Mustard and maize at HQ, BINA have different phosphorus contents.
By using graphical and statistical approaches, the estimated plant tissue critical level of P for the mustard crop was discovered to be 0.33% and 0.23%, respectively (Figure 6, Table 5).
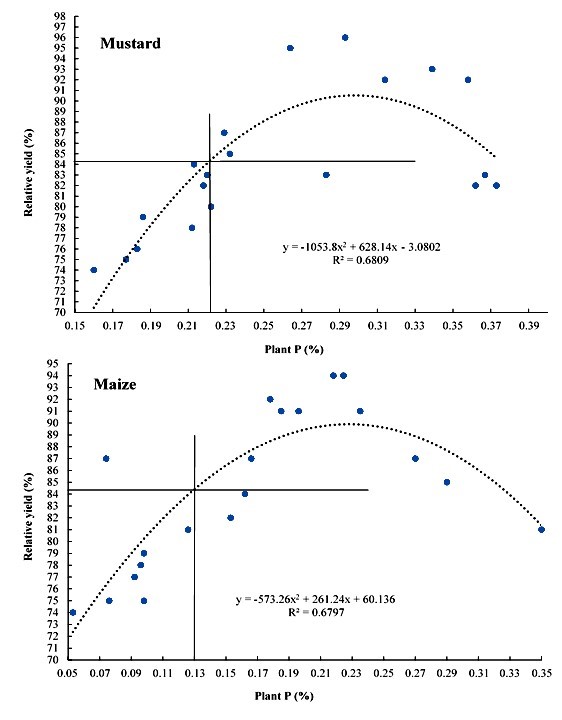
Table 5
Graphical and statistical methods for determination of the critical plant P values for mustard and maize.
| Crops | Element | Methods for determination of the critical limit | R2 | |
|---|---|---|---|---|
| Statistical | Graphical | |||
| Mustard | Phosphorus | 0.33% | 0.23% | 0.695 |
| Maize | Phosphorus | 0.16% | 0.13% | 0.730 |
For the maize crop, the estimated plant tissue critical threshold of P was discovered to be 0.16% (Figure 6). The essential amount of P for the maize crop, on the other hand, was discovered to be 0.13% (Table 5).
. Response of mustard and maize to P applications in field conditions
The various phosphorus levels have a major impact on biological yield. P stimulates early root development and growth, allowing a more effective use of nutrients from the deeper soil layer, which may explain the large increase in yield brought on by a sufficient P addition. Increases in the concentration within the soil have a significant impact on the uptake of this nutrient by seed and straw, increasing seed and stover yields.
. Mustard
The type of P used may have an impact on how crops respond to fertilization in terms of yield and soil fertility. There were substantial differences between treatments. Treatment T4 (100% STB of P) produced the highest yield of mustard (1.97 t ha−1) for the P reaction, outperforming treatments T2, T3, and T5 (Table 6). When the yield-contributing factors were considered, all measurements showed better results under the T4 treatment. As a result, the confirmed CL for the cropping systems for P response will result in increased output, more efficient resource utilization, and reduced production costs.
Table 6
Validation of the influence of phosphorus critical limit on the yield and yield-contributing traits of mustard (var. BINA Sharisha 9) grown in a farmer’s field in Nalitabari, Sherpur.
. Maize
The maize crop exhibited a significant response to the addition of P fertilizer in an appropriate amount for its growth and development. Treatment T4 (100% STB of P) generated the highest yield of maize (10.03 t ha−1), which showed a notable improvement over the T5 and T6 treatments (Table 7). All characteristics, except for plant height, were also greater in the T4 treatment when the yield-contributing features were taken into account.
Table 7
Validation of the influence of phosphorus critical limit on the yield and yield-contributing traits of maize (BARI Hybrid Maize 7) grown in a farmer’s field in Nalitabari, Sherpur.
. Discussion
Phosphorus (P) is most important for the plant’s physiological growth and development thus reflecting the yield of different crops. Phosphorus is essential for numerous physiological functions, such as light responses and the Calvin-Benson cycle of photosynthesis (Poorter et al., 2010). By preventing the synthesis of ATP and restricting RuBP regeneration, phosphorus shortage inhibits photosynthesis inhibiting ATP synthesis (Carstensen et al., 2018).
Research conducted previously on mustard (Brassica juncea L.) showed that the highest phosphorus doses, namely 60 kg ha−1 (Mir et al., 2010; Singh & Thenua, 2016) and 50 kg ha−1, resulted in the highest seed yield, oil content, and yield (Solanki et al., 2015). The highest dose of P application is extremely important for mustard cultivation and yield (Brennan & Bolland, 2009; Khan et al., 2000; Vicianová et al., 2020).
The P content in the soil below which mustard and maize might respond to additional P fertilizer was identified in the current investigation. These findings showed that mustard and maize had CLs of P 14.8 and 14.5 ppm, respectively. Currently, 10 ppm P is used as the critical level in all variations of the fertilizer recommendation guide for the fertilizer rate used in Bangladesh (FRG, 2018). The CL of P indicated in this study is greater than the value of the currently suggested fertilizer.
The intensive agricultural technique and minimal application of organic matter in the soil can account for this rise in the CL of P. Given the crucial level of P in soils, it is clear that applying P at a rate below 14 ppm of soil will not help plants that are P deficient. In addition to using soil test results, the CL of P in plant tissue can be used as a guide to decide when and how much P should be applied. According to the current investigation, mustard and maize had a tissue P concentration of 0.33% and 0.16%, respectively. It is already known that P becomes available to increase its effectiveness when applied at the ideal dose and appropriate time (Chien et al., 2011).
As shown by the crops, soil, and extraction methods, the CL of nutrients in soil changes. The soil types, soil pH, accessible moisture, and soil organic matter are key soil characteristics, because they affect the P availability in soil. Lack of organic matter causes the soil to become deficient in P since it is a source of P for the soil. To maximize the use of fertilizer and preserve a sustainable production system, periodic monitoring is necessary, because the CL will continue to change as a result of present agricultural methods.
When establishing the critical level, the graphical and statistical methods may differ in the CL of P. According to the graphical approach used in the results of this investigation, the CL for mustard and maize was 14.8 and 14.5 ppm, respectively. In contrast, according to the statistical technique, the CL of P was higher (18.9 ppm) for mustard crops and lower (12.3 ppm) for maize crops.
Researchers can use any method to calculate the CL of nutrients in the soil since the CL values are so close. Given that a greater proportion of soils will not meet the CL, we suggest choosing the maximum critical value determined using the graphical and statistical approach to assure higher crop production. An effective method should be able to predict the amount of nutrients that are available to plants as well as how responsive different types of crops are to fertilizer. In this situation, determination of the CL using two separate approaches is essential for establishment of the ideal amount of fertilizer needed for a typical crop (FRG, 2018).
The rice-based cropping system is the major trend in Bangladesh and samples of soil were taken from the mentioned cropping system in which T. Aman rice was common, where there was variation in rainfall, temperature, and humidity. In this study, the soil in the three separate AEZs: Level Barind Tract (AEZ-25), High Barind Tract (AEZ-26), and North Eastern Barind Tract (AEZ-27) was chosen for the study, and the soil samples were taken for their intense mustard and maize crop cultivation (Huq & Shoaib, 2013; Quddus, 2009; Shil et al., 2016). Samples of soil were taken from the open spaces of the selected areas, which were located in the districts of Naogang, Chapainawabganj, and Bogra, and were within 0 to 15 cm deep. For phosphate (P), out of the 26 soil samples, 14 were chosen from low-fertility soils, 6 from medium-fertility soils, and 6 from very-fertile soils. Based on the results of the first-year soil tests from a total of 720 soil samples collected nationwide, sampling sites were chosen. Next, 20 bulk soil samples for assessment of the P level were collected from the selected locations for the pot trials.
The soil study revealed variations in the P content and other physicochemical characteristics of soil due to the collection of soil samples from various regions of Bangladesh. The different critical values of P for mustard and maize (Huq & Shoaib, 2013; Quddus, 2009; Shil et al., 2016; SRDI, 2000) may have its roots in the diversified sampling approach. Murthy (2004) noted that the fluctuation in the considered locations that create substantial differences in the nutrient CL backed up this contention.
The shoot-dry biomass of crops cultivated in various soils was dramatically boosted by adding P to the soil. For instance, compared to the variant when no P was applied to the soil, the application of P to the soil resulted in an approximately 12% increase in shoot-dry biomass (averaged across mustard and maize).
As a key crop growth metric, dry matter accumulation is widely used to calculate the economic returns impacted by different treatments. This increased shoot biomass production recorded in this study was the result of more effective P absorption and metabolism, as confirmed by Richardson et al. (2011), Rose et al. (2011) and Wang et al. (2010). Therefore, it is essential based on an accurate assessment to have a sufficient supply of P of the soil’s P needs if we want to increase crop yield in the South Asian region (Hammond et al., 2009; Singh et al., 2014). The soil at or above the CL will benefit from P application to boost productivity and crop growth in all types of soil.
. Conclusions
In the various soils under study, the addition of P had a substantial impact on the shoot dry matter content and overall P uptake in mustard and maize crops. The estimated critical limit of P was determined to be 14.8 ppm for mustard crops and 14.5 ppm for maize crops. Both graphical and statistical methods revealed that the critical plant tissue P content for mustard at the designated growth phase (seven weeks) was 0.35%. For effective fertilizer application in Bangladesh, the findings of this study can be used to update fertilizer recommendation manuals. This study might also confirm that P fertilizer is essential for increasing mustard and maize economic production and for long-term soil P management below the required level.
