. Introduction
Ferula L. is one of the most species-rich genera within the Apiaceae family, comprising approximately 180–185 species that inhabit arid and semi-arid habitats across Eurasia (Plunkett et al., 2018). For a long time, the only comprehensive taxonomic revision of the genus was that conducted by Korovin in the 1940s (Korovin, 1947), despite the publication of several regional floristic studies (Korovin, 1951, 1959; Peşmen, 1972; Safina & Pimenov, 1984; Chamberlain & Rechinger, 1987). These traditional infrageneric classification systems based on morphology have recently been challenged by molecular studies, leading to the proposal of a new classification system for the genus (Panahi et al., 2018).
However, the authors of this new system acknowledged that numerous issues persist, rendering the system somewhat preliminary. Among the challenges complicating phylogenetic classification are extensive hybridization, rapid radiation, and confusion caused by the description of multiple, nearly indistinguishable species that, in many cases, likely represent variations among populations (Piwczyński et al., 2025; Panahi et al., 2015, 2018). To address these issues, genomic data for various taxa within the genus must be generated.
Recent genomic studies on Ferula have mainly focused on plastid genomes. In recent years, over 30 plastid genomes have been published, providing insights into their structures, evolution, and phylogenetic utility (Fan et al., 2021; Yang et al., 2022; Qin et al., 2023). Although these plastid-based phylogenies cover only a small fraction of the genus, they exhibit markedly better resolution than trees constructed from the internal transcribed spacer (ITS) and external transcribed spacer (ETS) regions of nuclear ribosomal DNA (nrDNA), either alone or in combination with a few plastid intergenic spacers and introns. While plastids are typically inherited uniparentally, most often maternally in angiosperms, including the Apiaceae, their phylogenies may not fully correspond to species relationships in cases of hybridization (Gitzendanner et al., 2018). Nevertheless, when analyzed together with nuclear markers, they enable the investigation of key evolutionary processes, such as hybridization, introgression, and incomplete lineage sorting (Blair, 2023).
Despite these limitations, complete plastid genomes offer distinct advantages in phylogenetic studies. Whole plastomes provide thousands of informative characters from coding, non-coding, and structural regions, thereby enhancing the resolution at both deep and shallow phylogenetic levels (Guo et al., 2017). They also reveal structural rearrangements, such as IR expansions, contractions, and gene losses, which may, in some cases, carry lineage-specific phylogenetic signals (Du et al., 2022; Könyves et al., 2021; Cao et al., 2024).
Ferula communis is a polymorphic species primarily distributed in the Mediterranean region. It encompasses various chemotypes and morphotypes, often with poorly defined boundaries (Sànchez-Cuxart & Cid, 1998; Elalaoui-Faris & Cauwet-Marc, 2003; Dettori et al., 2014, 2016). Moreover, several species described from Africa and the Mediterranean islands over the past two centuries exhibit strong morphological similarities to F. communis. Recent molecular data have confirmed their close relationship (Panahi et al., 2018; Piwczyński et al., 2018). This evidence has led to the inclusion of F. communis and its allies within the subgenus Ferula in a newly proposed classification system for the genus (Panahi et al., 2018).
Like many species of Apiaceae, F. communis and its allies are sources of aromatic oleo-gum-resins that have been valued since antiquity for use as remedies, condiments, and incense. The names ΝΑΡΘΞ and ΑΜΜΩΝΙΑΚΗ of Dioscorides refer to F. communis and its close relative F. tingitana L., respectively (Evergetis & Haroutounian, 2015), and their resins still bear the name of African ammoniacum, in contrast to the Persian ammoniacum secreted by F. ammoniacum (D.Don) Spalik, M. Panahi, Piwczyński & Puchałka (a species previously treated as Dorema ammoniacum D.Don, now considered a synonym) (Korovin, 1951).
In this study, we assembled, annotated, and analyzed the structural organization of the F. communis plastid genome. Additionally, we performed a comparative analysis with other published genomes of Ferula. We also conducted a phylogenetic analysis to confirm the placement of F. communis within the genus, as postulated by Panahi et al. (2018).
. Materials and methods
. Sample collection, DNA extraction, and sequencing
A fresh leaf of Ferula communis was collected in Menorca, Spain (39°54'25.9"N, 4°15'30.0"E) on May 16, 2016, by Piwczyński & Corral. The sample was immediately placed in silica gel to preserve DNA integrity and assigned the voucher code KEIB_AP_00184. The specimen was then deposited in the Herbarium of the Department of Ecology and Biogeography, Faculty of Biological and Veterinary Sciences, Nicolaus Copernicus University in Toruń. (Voucher information for the sample used in this study is summarized in Table S1).
DNA isolation was performed using the DNeasy® Plant Mini kit (Qiagen, Venlo, The Netherlands) following the manufacturer’s protocol, with an additional cleaning step using 500 μl of 99% ethanol. DNA quality was assessed using 1% agarose gel electrophoresis stained with GelRed, and its concentration was measured using a Qubit 3.0 fluorometer (Invitrogen, Waltham, MA, USA) with the dsDNA High Sensitivity Assay kit. Whole-genome sequencing was performed by Macrogen (Seoul, Republic of Korea) using an Illumina NovaSeq 6000 platform (PE 2 × 150 bp).
. Plastid genome assembly, annotation and repeat sequence analysis
The plastid (pDNA) genome of F. communis was assembled de novo using GetOrganelle v.1.7.1 (Jin et al., 2020) and NOVOPlasty v.4.3.1 (Dierckxsens et al., 2017). For the former, reads were first trimmed and filtered to remove low-quality and ambiguous bases using Trimmomatic v.0.39 (Bolger et al., 2014) with the following settings: ILLUMINACLIP:TruSeq3-PE-2.fa:2:30:10, SLIDINGWINDOW:4:15, MINLEN:50. For the latter, raw Illumina reads were used, as recommended by the software authors, with a default k-mer size of 39 and the complete plastid genome of F. kirialovii (GenBank no. OP324740) was used as a seed.
The assembled plastid genome of F. communis was annotated using the web-based annotation pipeline CPGAVAS2 (Shi et al., 2019), which includes a curated dataset of 2,544 plastomes. Additionally, the plastid genome of F. olivacea (GenBank no. ON324046) was used as a reference to confirm the annotation and identify genes not detected by the curated dataset. To validate the annotated tRNA genes, tRNAScan-SE v.2.0.2 (Chan et al., 2021) and ARAGORN v.1.2.36 (Laslett & Canback, 2004) were used. Inverted repeat (IR) regions and dispersed repeats were identified using REPuter, with a minimum repeat length of 30 bp and a maximum of one mismatch (Hamming distance = 1) (https://bibiserv.cebitec.uni-bielefeld.de/, accessed 2023-02-06). To analyze the contraction/expansion of the IR regions and boundary shifts among the four plastid genome regions (IRa, IRb, LSC, and SSC), a comparative analysis was performed using the online visualization tool IRscope (Amiryousefi et al., 2018) across 30 Ferula species and two outgroup species (TTable S2). Simple sequence repeats (SSRs) were identified using two pipelines, MISA v.1.0 (Beier et al., 2017) and TRF v.4.0.9 (Benson, 1999), with minimum repeat counts set to 8, 4, 4, 3, 3, and 3 for mono-, di-, tri-, tetra-, penta-, and hexanucleotides, respectively. These tools were also used to detect long tandem repeats (longer than 6 bp). The resulting annotations were saved in the GFF3 format using Maker v.2.31 (Campbell et al., 2014). Finally, a circular genome map was generated using the online tool, Chloroplast Genome Viewer (CPGview) (Liu et al., 2023).
. Analysis of sequence polymorphism and selection on protein-coding genes in Ferula
To examine nucleotide polymorphisms across the plastid genomes of Ferula, we analyzed the pDNA of 30 Ferula species, including F. communis, with the remaining 29 species retrieved from GenBank (Table S2). All genomes were aligned using MAFFT v.7.47 with the default settings (Katoh & Standley, 2013). For the analysis, the LSC, SSC, and one copy of the IR region were included, as incorporating both IR copies would be redundant because of their near-identical sequence. Nucleotide diversity (π) (Nei, 1996) was evaluated using DnaSP v.6.12.03 (Rozas et al., 2017) employing a sliding window approach with a window length of 800 bp and a step size of 200 bp.
To assess the direction and magnitude of selection on amino acids in plastid protein-coding genes of Ferula, coding sequences were first aligned codon-wise using MAFFT v.7.47, followed by manual curation to remove ambiguously aligned regions, gaps, and premature stop codons. Phylogenetic relationships among sequences were inferred from the concatenated plastid gene set using RAxML v.8.2.12 under the GTR+G model, and the resulting maximum-likelihood tree was used as input for CODEML analyses. Positive selection was evaluated using site models implemented in CODEML (PAML v.4.10; Yang, 2007), focusing on two pairs of models: M1a versus M2a and M7 versus M8 (Álvarez-Carretero et al., 2023), which have previously been demonstrated to be effective in identifying positive selection. In each pair, the null models (M1a, M7) assumed no positively selected codons (ω ≤ 1), whereas the alternative models (M2a, M8) allowed for codons under positive selection (ω > 1). Likelihood ratio tests (LRTs) were computed as 2 × (lnL_alt − lnL_null) and assessed against a chi-square distribution with two degrees of freedom (critical values: 5.99 at α = 0.05, and 9.21 at α = 0.01). The main distinction between these model pairs lies in their respective formulations of the parameters that determine the proportion of sites under different selection regimes: purifying (ω < 1), neutral (ω = 1), and positive (ω > 1). When the LRT results favored models showing significant evidence of positive selection, the Bayes Empirical Bayes (BEB) method (Yang et al., 2005) was employed to identify specific codons with posterior probabilities ≥ 0.95. Analyses were performed on a per-gene basis, excluding sites in ambiguous or poorly aligned regions of the sequence.
. Phylogenetic analyses
The exons from 78 plastid genome genes of 30 Ferula species, along with two outgroup species, one from the tribe Daucinae and one from Torilidinae, were used in the phylogenetic analyses (Table S2). These outgroup species have been identified as the closest relatives of the tribe Ferulinae based on genomic data (Clarkson et al., 2021; Piwczyński et al., 2021).
The phylogenetic position of Ferula communis was inferred using both maximum likelihood (ML) and Bayesian inference (BI) methods. For ML, RAxML v.8.2.12 (Stamatakis, 2014) was used, and for BI, MrBayes v.3.2.7 (Ronquist et al., 2012). The optimal partitioning scheme and substitution models for the first, second, and third codon positions were selected using PartitionFinder v.2.1.1 (Lanfear et al., 2017), guided by the corrected Akaike information criterion (AICc). The search algorithm was set to explore all possible partitioning combinations (search = all).
For the ML analysis, the substitution model in PartitionFinder was fixed as GTR + G (because RAxML supports only this model), and we focused solely on identifying the best-partitioning scheme. In contrast, MrBayes allows for a broader range of models, although it is also limited to a specific subset of general time-reversible models. Accordingly, we set the PartitionFinder models to “mrbayes.” In all analyses, the branch lengths were linked across partitions (branchlengths = linked).
ML analyses involved 1,000 independent searches, each starting from a unique randomized maximum parsimony tree. Branch support (BS) was assessed using 1,000 standard, non-parametric bootstrap replicates. For the BI analyses, two independent runs were performed simultaneously, each with four Monte Carlo Markov chains run for 10,000,000 generations, sampling every 1,000 generations. All priors were maintained at their default settings. The initial 25% of the sampled trees were discarded as burn-in, and the results were summarized on a 50% majority rule consensus tree. We used Tracer v.1.7.1 (Rambaut et al., 2018) to assess the effective sample size (ESS) of the estimated parameters and check convergence across runs.
. Results
. The plastid genome of Ferula communis
. General features, gene content, and organization of Ferula communis plastid genome
From a total of 1,399,948,868 raw Illumina sequence reads, the plastid DNA of F. communis was assembled using GetOrganelle and NOVOPlasty. The resulting genome was 166,696 bp in length, with a GC content of 38%. However, the GetOrganelle assembly produced two separate scaffolds (assembly paths 1 and 2), which were interpreted as structural haplotypes. These haplotypes are identical in size but differ in the orientation of the small single-copy (SSC) region of the chloroplast genome. In contrast, NOVOPlasty yielded a single, unified pDNA assembly.
The Ferula communis plastid genome exhibits a quadripartite structure typical of angiosperms, comprising a pair of inverted repeats (IRa and IRb), a large single-copy region (LSC), and a small single-copy region (SSC) (Figure 1). The LSC and SSC regions were 85,349 bp and 17,685 bp in length, respectively, and were separated by two IR regions, each measuring 31,831 bp. The genome contained 133 genes, including 88 protein-coding genes, 37 tRNA genes, and 8 rRNA genes (Figure 1 & Table S3). Among these, 13 protein-coding genes and 8 tRNAs each contained one intron. Two genes, ycf3 and clpP, were characterized by the presence of two introns (Table S4). Except for trnL-UAA, which contains a group I intron, all other introns were classified as group II.
Figure 1
Map of the plastid genome of Ferula communis. Genes inside the circle are transcribed clockwise, and those outside are transcribed counterclockwise. The darker gray inner circle corresponds to the GC content estimated at a 5 kb window size. Different colors represent different functional genes, and the numbers in brackets next to the gene represent the GC content of each gene. The inverted repeat regions are also marked (light violet color).
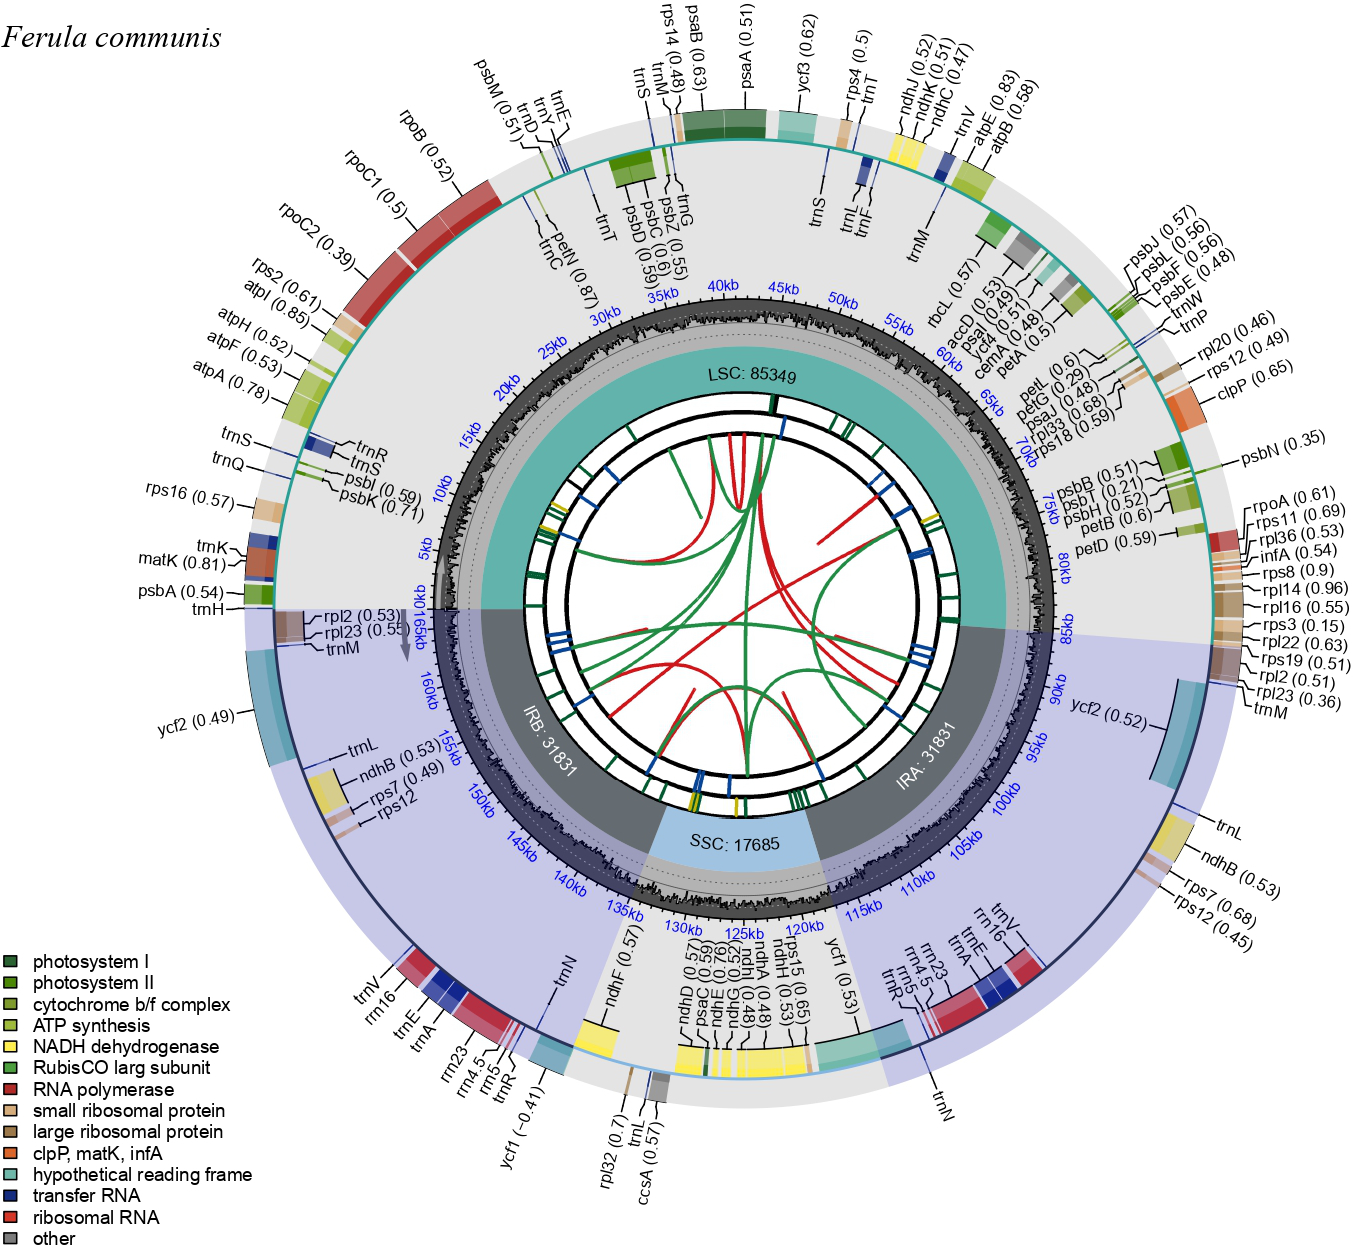
Based on their functions, the pDNA genes of F. communis may be classified as follows: (a) genes related to photosynthesis, including those coding photosystem I, photosystem II, ATP synthase, NADH-dehydrogenase, the cytochrome b/f complex, and RUBISCO; (b) self-replication genes, including ribosomal and transfer RNAs; (c) non-photosynthetic genes with known functions, such as accD, ccsA, cemA, clpP, infA, and matK; and (d) genes of unknown function, such as ycf1, ycf2, ycf3, ycf4, and ycf15 (Table S3).
. Expansion and contraction of inverted repeat (IR) regions
A comparison of the IR boundary regions among 30 Ferula species, Daucus carota, and Anthriscus sylvestris revealed slight differences in F. communis at the IRb/SSC and IRa/LSC junctions relative to D. carota and A. sylvestris. In D. carota, the ndhF gene is located in the SSC region precisely at its boundary with IRb, whereas in A. sylvestris, it extends by 92 bp into the IRb region. In F. communis and 24 other Ferula species, the ndhF gene extended up to 16 bp into the IRb region. In the remaining species, the ndhF gene was positioned 0–58 bp away from the IRb/SSC junction (Figure S1). Additionally, the trnH gene at the LSC/IRa boundary extended 3–10 bp into the IRa region in all Ferula species except F. olivacea, F. hexiensis, and D. carota. The size of the inverted repeat (IR) region also showed slight variation across Ferula species (Figure S1). When mapped onto the plastid phylogeny, the organization of the IR boundaries does not correspond to phylogenetic relationships or do not follow clade-specific patterns among the sampled Ferula species; rather, shifts in genes such as ndhF and trnH occur sporadically across lineages, with similar boundary configurations appearing in both closely related Ferula taxa and in different lineages of Apiaceae (e.g., Daucus, Anthriscus), suggesting that IR boundary variation does not exhibit any consistent phylogenetic structure within the genus (Figure S2).
. Analysis of repeat elements
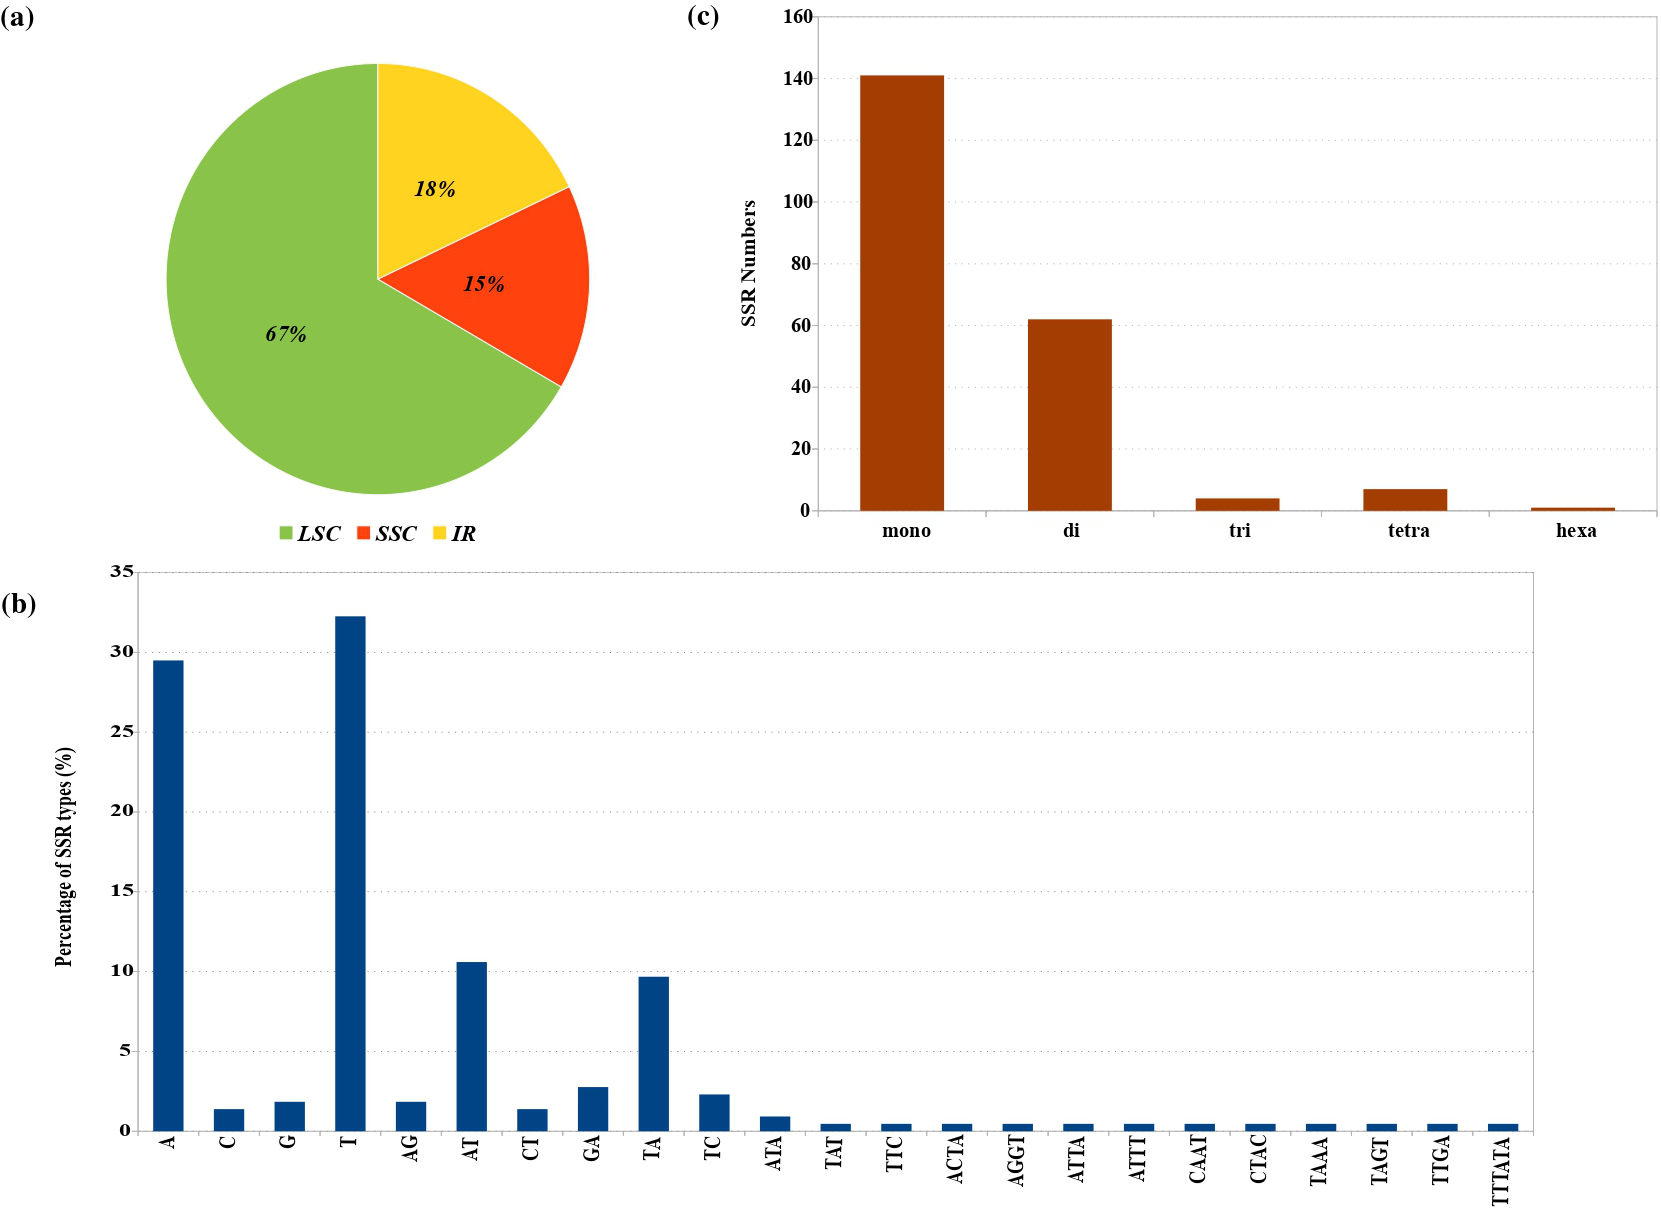
The F. communis plastid genome contains 217 SSRs. The majority of these SSRs were located in the LSC and SSC regions, accounting for 82.01% of the total (Figure 2a). Mono-, di-, tri-, and tetranucleotide SSRs represented 65%, 26%, 1.84%, and 4.15% of all SSRs, respectively. Hexanucleotide SSRs were rare in the F. communis plastid genome (Figure 2c). Among mononucleotide SSRs, A/T repeats constituted the vast majority (61.75%), whereas C/G repeats were infrequent (3.22%). For dinucleotide SSRs, AT/TA repeats were the most common, representing 20.28% of the total (Figure 2b). In addition to SSRs, the repeat sequences of the F. communis plastid genome, analyzed using REPuter and Tandem Repeats Finder, were classified into three categories: forward, palindromic, and tandem repeats, most of which are located in Intergenic Spacer (IGS) regions. In total, 17 forward repeats, 13 palindromic repeats, and 24 long tandem repeats were identified in the genome. Among the tandem repeats, three exhibited sequence variation in the form of indels, with estimated proportions of 8%, 11%, and 16%, corresponding to approximately 2–3 bp differences (Table S5, S6).
. Nucleotide diversity hotspots and selection on protein genes in Ferula
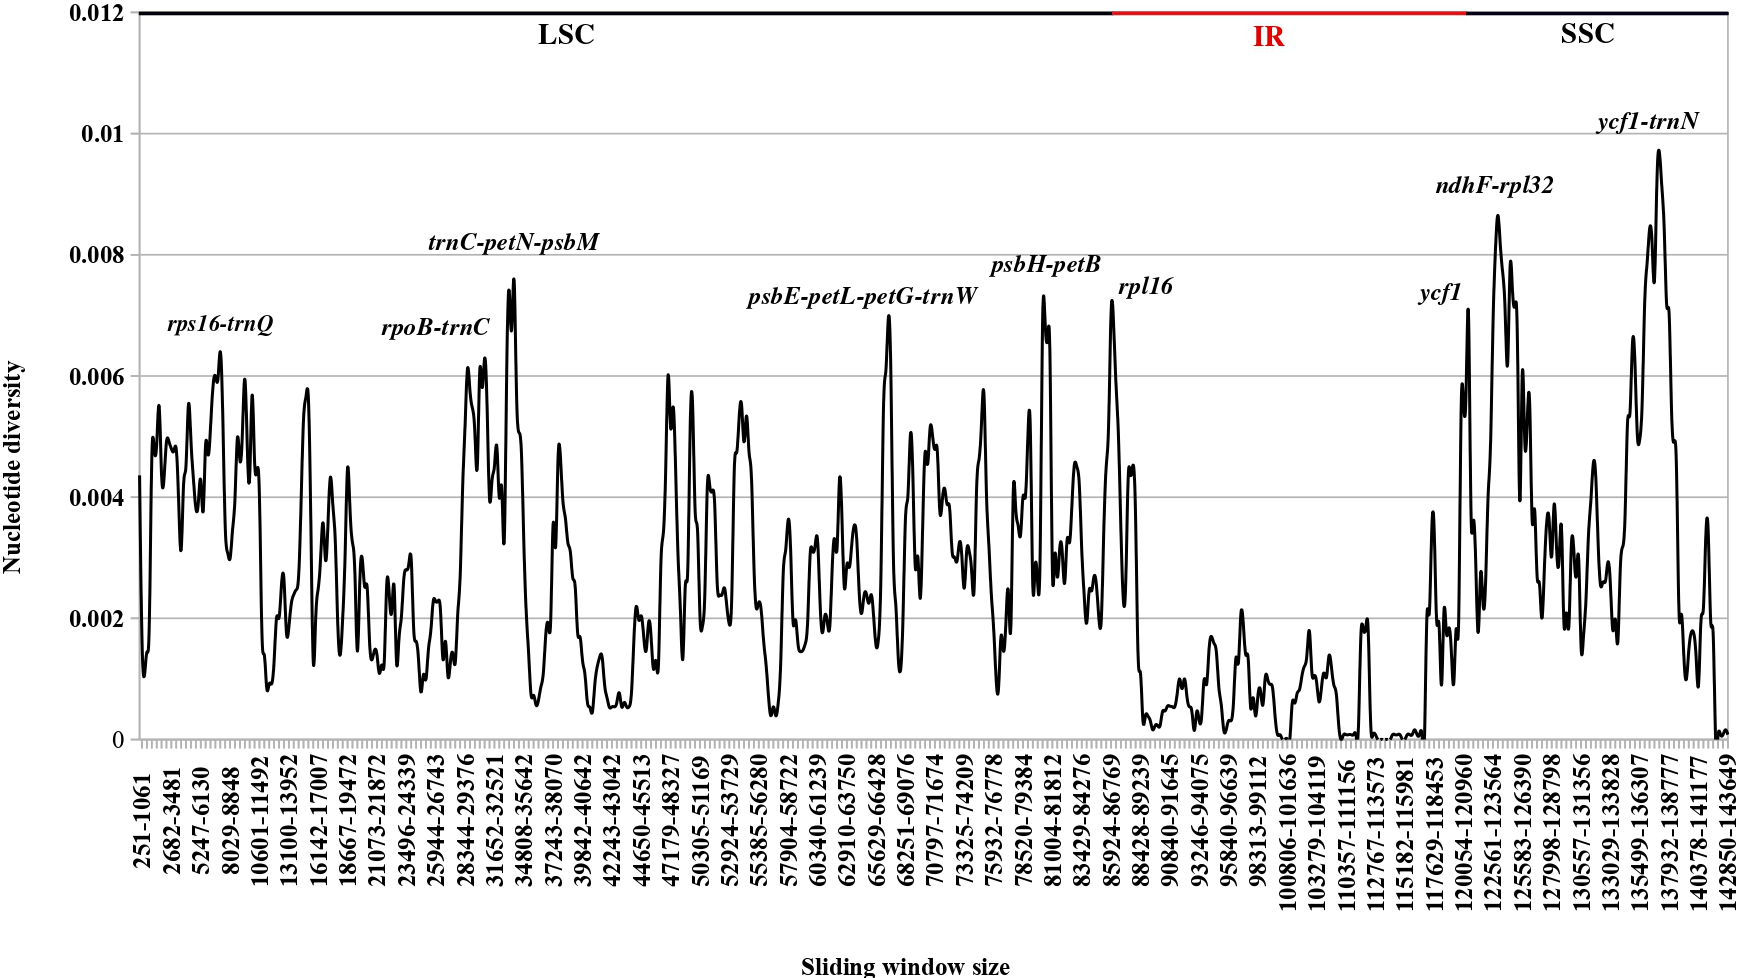
Nucleotide diversity analysis across 30 plastid genomes of Ferula species revealed that the IR region was the most conserved, showing significantly lower variability than the LSC and SSC regions (Figure 3). The regions with the highest variability, those with nucleotide diversity (π) values above 0.006, were primarily located in intergenic spacers, but certain coding regions, notably ycf1, also exhibited elevated diversity, often exceeding 0.006.
Notably, high nucleotide diversity among the compared Ferula species was observed in the intergenic spacers rps16–trnQ, rpoB–trnC, trnC–petN–psbM, psbE–petL–petG–trnW, psbH–petB, ndhF–rpl32, and ycf1–trnN. Of these IGSs, five were located in the LSC region and two in the SSC region. Additionally, rpl16 in the LSC region and ycf1 in the SSC region were identified as the most variable genes among the examined Ferula species (Figure 3).
Figure 3
Analysis of Nucleotide diversity in the pDNA genome of 30 Ferula species using the Sliding Window approach (window length: 800 bp, step size: 200 bp).
Selective pressure on protein-coding genes was assessed by calculating the ratio of non-synonymous (dN) to synonymous (dS) substitutions across 75 coding sequences (CDS) from 30 Ferula species. To detect positive selection, we conducted likelihood ratio tests (LRT) by comparing two pairs of site models (M1a vs. M2a and M7 vs. M8). The LRT results revealed significant evidence of positive selection in five protein-coding genes (ndhF, petD, ndhD, ccsA, and rpl32) under both model comparisons. Additionally, one gene, ndhH, was identified as positively selected in the M7 vs. M8 comparisons (Table S7). Bayes Empirical Bayes (BEB) analysis further identified codon sites under positive selection with a posterior probability > 0.95. Specifically, ndhF contained four positively selected sites, petD and ndhD had three each, ccsA and rpl32 had two each, and ndhH had one positively selected site (Table S8).
. Phylogenetic position of Ferula communis
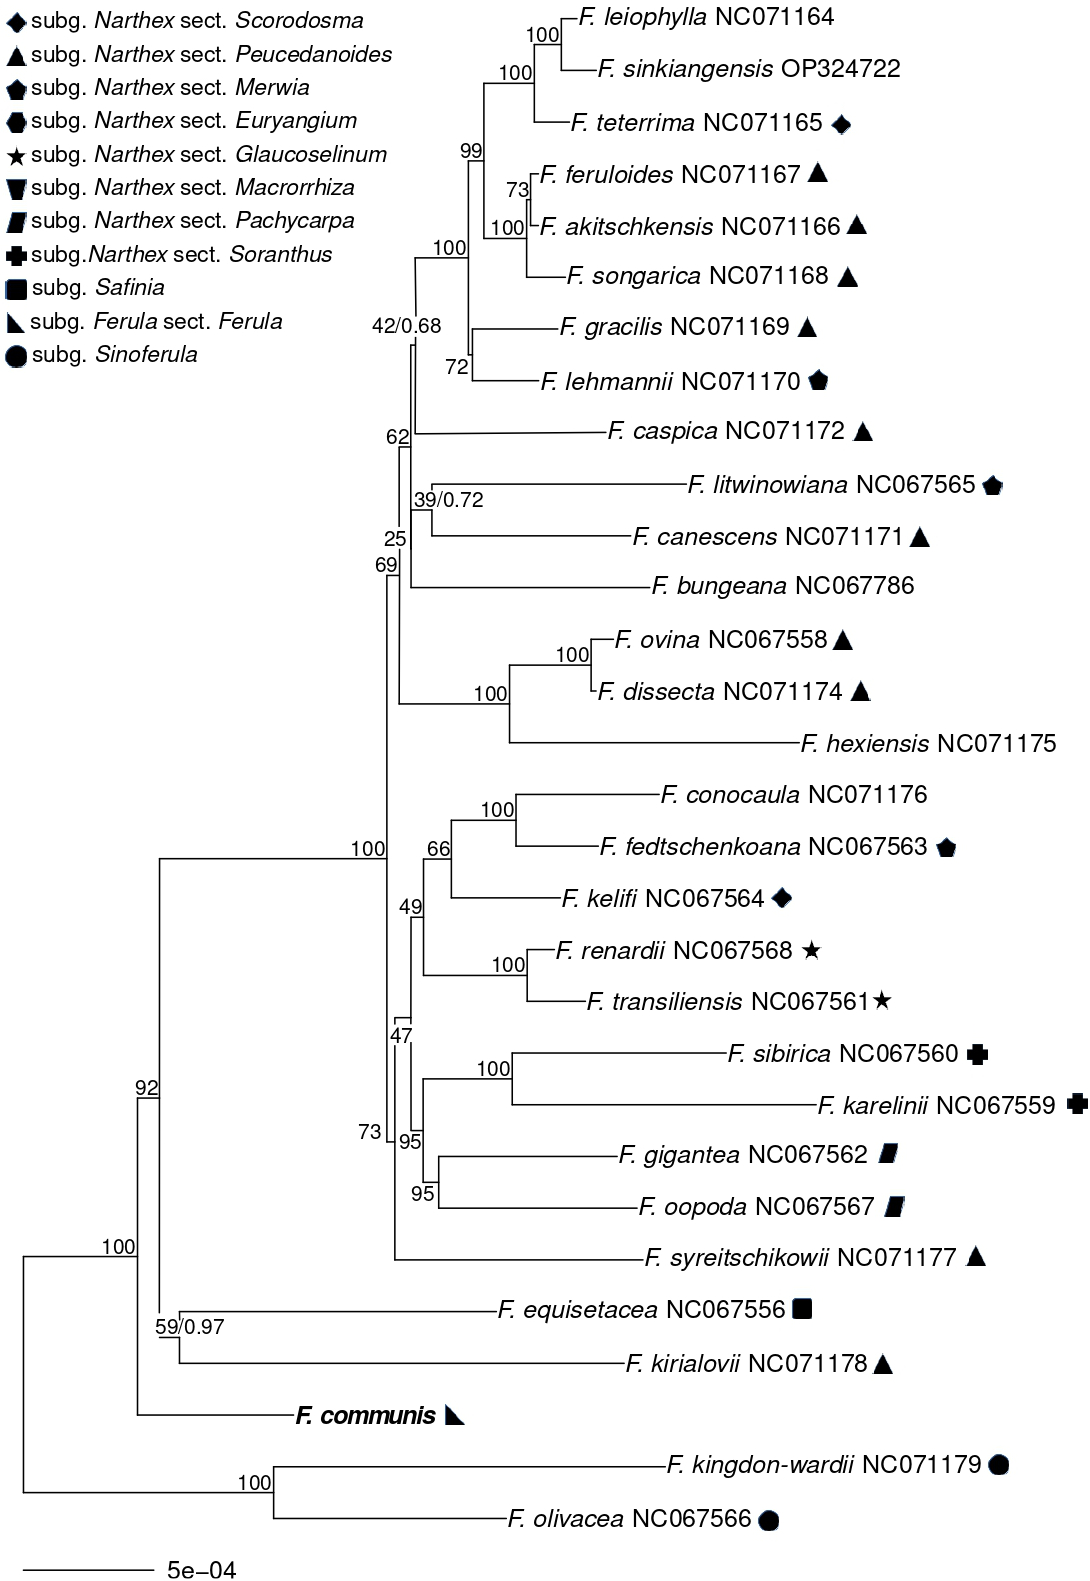
The alignment of exons was 69,489 bp long and included 1,744 parsimony-informative sites. PartitionFinder selected separate substitution models for the first, second, and third codon positions in both ML and BI analyses. The GTR + I + G model was selected for both analyses and all three codon positions. Both ML and BI analyses consistently placed Ferula communis with strong support (BS = 100%, PP = 1.00) as the next branch after the subgenus Sinoferula, represented by F. kingdon-wardii and F. olivacea (Figure 4). The subsequent branch after F. communis comprised F. equisetacea and F. kirialovii, supported by a low BS value (<70%), but a high PP (0.97). The former species belongs to the subgenus Safinia, while the latter is included in the subgenus Narthex, which forms the next clade after these two species.
Figure 4
The maximum likelihood tree, based on plastid genome exons from 30 Ferula species, assigns symbols to each species according to the intrageneric taxonomic ranks from Panahi et al. (2018). Species without symbols were not included in this revision. Bootstrap support values are shown along the branches, and posterior probabilities are 1.00, unless a different value follows the bootstrap score. For clarity, outgroup taxa were omitted.
. Discussion
. Characteristics of the plastid genome of Ferula communis
In angiosperms, the plastid genome typically exhibits a highly conserved structure, gene content, and gene order (Dong et al., 2014). The Ferula communis plastid genome follows the common circular quadripartite structure typical of angiosperms, comprising two inverted repeat regions, a small single-copy region, and a large single-copy region. This pattern is consistent with the other assembled plastid genomes of Ferula species (Yang et al., 2022; Qin et al., 2023). However, the GetOrganelle assembly revealed two distinct haplotypes in the pDNA of F. communis. These haplotypes were identical in size but differed in gene orientation within the SSC region. While heteroplasmy, the presence of two distinct structural haplotypes within a single organism, has been documented in certain angiosperms (Stein et al., 1986; Martin et al., 2013), no clear biological mechanism has been established to explain its occurrence. It has been proposed that large IRs may facilitate intermolecular recombination, thereby helping to maintain nearly equal proportions of the two SSC haplotypes (Stein et al., 1986).
The plastid genome size, gene order, and composition of F. communis closely resemble those of other sequenced Ferula plastomes, with only minor differences (Yang et al., 2022; Qin et al., 2023). Slight variation was observed in the IRb/SSC boundary region of F. communis compared to Daucus carota and some other Ferula species, although a similar configuration occurred among both closely and distantly related species. Thus, the IR boundary organization does not exhibit a clear phylogenetic pattern. Similar shifts at IR/SSC or IR/LSC junctions have been widely documented in Apiaceae (Downie & Jansen, 2015; Gou et al., 2020) and across other angiosperm families (Li et al., 2021; Dong et al., 2015), highlighting that boundary dynamics are common drivers of plastome diversity. Although the overall pDNA structure is generally conserved, the expansion and contraction of IR boundaries can cause local rearrangements and changes in gene adjacency (Peery, 2015; Zhu et al., 2016). Sequence alterations at the IR borders directly influence plastome size variation (Khakhlova & Bock, 2006). Minor shifts, typically under 100 bp, at the LSC/IR border are frequently observed across angiosperms (Goulding et al., 1996), whereas major contractions without complete IR loss are rare but have been reported in legumes and Geraniaceae (Guisinger et al., 2011; Choi et al., 2019). Thus, the slight IR boundary variations observed in F. communis are consistent with the general evolutionary trends in angiosperms.
Interestingly, variations in intergenic spacer regions and LSC/IR boundaries may also result from the transfer of genetic material between organellar genomes (Liu et al., 2021; Gu et al., 20192022; Park & Park, 2023). This phenomenon, known as intracellular gene transfer (IGT), is common in plants and often involves the movement of genomic segments between plastids, mitochondria, and the nucleus (Jo et al., 2024). For instance, Jo et al. (2024) reported two fragments of mitochondrial origin, ranging from 2.8 to 5.8 kb, located within the rps12–trnV IGS of the plastid genomes of some Ferula species. Although mitochondrial DNA introgression has not yet been investigated in F. communis, further comparative analyses of plastid and mitochondrial genomes across additional Ferula species may reveal similar events as more genomic data become available.
. Sequence divergence of the pDNA genome of Ferula communis
The plastid genomes of Ferula species exhibit substantial variation, particularly in non-coding regions, such as IGSs, showing markedly higher sequence diversity than coding regions (Figure 3). These IGSs are primarily located in the LSC region of the plastid genome, which is rich in SSRs. Although the molecular mechanisms underlying the evolution of SSRs remain unclear, replication slippage and nucleotide substitution have been proposed as major drivers (Qin et al., 2015; Sathanandam et al., 2022).
Among the various SSR types, mononucleotide repeats were the most prevalent in the F. communis plastome, accounting for 65% of all SSRs (Figure 2 b–c). The distribution of mono-, di-, and tetranucleotide repeats closely resembles that observed in Daucus carota, Zea mays, and other Ferula species (Maier et al., 1995; Ruhlman et al., 2006; Yang et al., 2022; Qin et al., 2023). In contrast, tri- and hexanucleotide repeats were much less frequent and, as with other types, were mostly confined to non-coding regions. Although tri- and hexanucleotide insertions may also occur in coding regions, as they do not disrupt reading frames (Shukla et al., 2018; Rabeh et al., 2024), we did not detect such repeats in F. communis.
Given their high variability, IGS regions have been widely used in phylogenetic studies to resolve relationships within the Apiaceae. Our analysis identified seven IGS regions with high variability across the Ferula species (Figure 3). These regions have been employed in phylogenetic studies to elucidate the relationships within various clades of Apiaceae (Spalik et al., 2009; Spalik et al., 2010; Downie & Jansen, 2015; Panahi et al., 2015; Piwczyński et al., 2018; Mustafina et al., 2019; Park et al., 2019). For instance, Piwczyński et al. (2018) assessed the utility of three highly variable plastid markers – trnH–psbA, trnS–trnG, and atpB–rbcL – for resolving phylogenetic relationships within Ferula. However, they found that these markers provided fewer parsimony-informative sites than nuclear ITS. Moreover, the phylogenetic trees based on pDNA and ITS were found to be incongruent. This incongruence likely results from processes such as hybridization or the lineage-specific, often rapid, and structurally variable evolution of IGS regions, which can obscure homologous sites and complicate phylogenetic inference (Alvarez & Wendel, 2003; Baldwin et al., 1995). These findings highlight the potential biases associated with IGS markers due to our limited understanding of their molecular evolution. An emerging approach to overcome such limitations is the use of complete plastome sequences for species discrimination, commonly referred to as “superbarcoding.” Compared to traditional DNA barcodes, complete plastomes provide substantially more informative sites, thereby improving the phylogenetic resolution among closely related species (Dong et al., 2014; Yang et al., 2022; Qin et al., 2023). In Ferula, where morphological similarity and frequent hybridization complicate species delimitation, plastome-scale data offer a robust framework for accurate species identification and evolutionary inferences. Incorporating complete plastome sequences in future studies is expected to enhance species delimitation, clarify phylogenetic relationships, and support more comprehensive biogeographic and evolutionary analyses within this complex genus.
. Positive selection on pDNA genes in Ferula communis
The dN/dS ratio, which compares the rate of non-synonymous to synonymous nucleotide substitutions, offers insight into the selective pressure on protein-coding genes. Our analysis, based on site-specific models and likelihood ratio tests (M1a vs. M2a and M7 vs. M8) (Table S7), along with Bayes Empirical Bayes (BEB) analysis, provided strong evidence for positive selection in five genes: ccsA, ndhD, ndhF, petD, and rpl32. Weak support was also observed for positive selection in ndhH, as it was supported only in one model comparison (M7 vs. M8) and the LRT results (Table S8). These results suggest that certain codon sites in these genes may have undergone adaptive changes to enhance their function.
Our findings differ from those of Qin et al. (2023), who identified 12 genes under positive selection in Ferula plastomes using a branch-site model. Notably, none of the genes identified in our study overlapped with theirs. This discrepancy likely reflects the different analytical approaches. Qin et al. (2023) employed a branch-site model and included outgroup comparisons, detecting genes under selection in Ferula relative to the outgroups. In contrast, our site-specific analysis aimed to detect selection acting on genes across the genus without outgroup comparisons, as the choice of outgroup can influence the results of the analysis.
Among the genes under selection, ccsA encodes a protein essential for heme attachment to cytochrome c, a key component of the electron transport chain (Xie & Merchant, 1996; Stoebe et al., 1998). Positive selection in ccsA has also been reported in Brassicaceae (Cardamine) (Hu et al., 2015), Orchidaceae (Dong et al., 2018), and Prunus mume (Huang et al., 2022). Similarly, Dong et al. (2018) identified several positively selected sites in petD, which encodes subunit IV of the cytochrome b6/f complex, a crucial component of the photosynthetic electron transport chain. Moreover, genes encoding ribosomal proteins, such as rpl32 (large subunit), have been shown to exhibit positive selection across multiple plant lineages (Shrestha et al., 2020). Because the plastid genome evolves as a single linkage group, distinguishing genes directly targeted by selection from those that respond indirectly to selection is challenging. Nevertheless, these findings underscore the significance of these genes in response to selection pressures, likely associated with optimizing photosynthetic efficiency.
. Phylogenetic position of Ferula communis
Phylogenetic analysis of Ferula species strongly supports the distinct placement of Ferula communis (BS = 100%, PP = 1.00), branching after the subgenus Sinoferula, represented here by F. kingdon-wardii and F. olivacea (Figure 4). This finding corroborates the recent infrageneric classification system of the genus based on combined nrDNA ITS and three plastid markers (Panahi et al., 2018). Although our analysis was performed using exons of 78 protein-coding chloroplast genes rather than the three non-coding regions applied by Panahi et al. (2018), the placement of F. communis is consistent with their results. In this system, F. communis and its allies form section Ferula, a classification supported by their primarily Mediterranean distribution (Pimenov & Leonov, 1993; Panahi et al., 2018; Nieto Feliner et al., 2023).
However, phylogenetic relationships within other parts of the Ferula plastid tree, especially in the subgenus Narthex, are less congruent with the proposed classification system. This discordance may stem from multiple factors, including gene flow via migration and introgression (Panahi et al., 2015, 2018; Puchałka et al., 2023). To resolve such conflicts, plastid markers should be supplemented with nuclear markers to test various hypotheses regarding gene flow.
. Supplementary material
The following supplementary material is available for this article:
Table S1. Voucher information for Ferula sample used in this study.
Table S2. The corresponding GenBank reference numbers for the plastid genomes used in the comparative analysis and for outgroups were utilized to determine the position of Ferula communis in the phylogenetic tree.
Table S3. Gene composition of the plastid genome of Ferula communis, categorized by function, based on the complete genome assembly.
Table S4. Distribution of intron and exon lengths in genes of the Ferula communis plastid genome with group classifications. For trans-spliced genes such as rps12, the 5’exon (Exon I) is physically separated from the 3’exons (Exon II and Exon III), and splicing occurs post-transcriptionally; introns are reported only between contiguous exons, so Intron II is not present in rps12.
Table S5. REPuter analysis results of forward and palindromic repeats in the plastid genome of Ferula communis: detailed insights on repeat length, location, and genomic regions.
Table S6: Summary of tandem repeats identified in the Ferula communis plastid genome, including key metrics: genomic positions (Indices, start–end in bp), period size, copy number, consensus length, match percentage, indel percentage, Score, base composition (absolute counts of A, C, G, T in the consensus sequence), and entropy scores as indicators of sequence complexity.
Table S7. Results of model comparisons for selection pressure analysis (dN/dS) on plastid genes with positively selected sites in compared Ferula species, including ΔlnL values, degrees of freedom (df), and p-values for various evolutionary models.
Table S8. A comprehensive evaluation of selection pressure (dN/dS) on plastid genes within compared Ferula species, detailing likelihood values (lnL), parameter estimates, and specific sites under selection as determined by models favors positive selection sites (M2a & M8).
Figure S1. The structural variation in the boundaries of the Large Single Copy (LSC), Small Single Copy (SSC), and Inverted Repeat (IR) regions across the plastid genomes of 30 Ferula and two outgroup species. It highlights differences in gene positioning, boundary shifts, and the movement of genes such as ndhF at the IR/SSC junctions, providing insights in the dynamics of plastid genome organization within the genus.
Figure S2. The phylogenetic tree based on plastid genes illustrates the organization of IR boundaries, specifically the IRb/SSC region. The movement of the ndhF gene into or away from the IRb region does not display any clear phylogenetic structure among the compared Ferula species. A left-pointing arrow indicates the movement of the ndhF gene into the IRb region, while a right-pointing arrow represents its movement away from the IRb region. The size of the arrow corresponds to the number of base pairs (smaller arrows indicate fewer base pairs). A square symbol indicates that the ndhF gene is located precisely on the IRb/SSC boundary.
Data availability
The assembled and annotated genome of Ferula communis has been submitted to NCBI (https://www.ncbi.nlm.nih.gov) with GenBank no. PP693041.
