. Introduction
Wax gourd [Benincasa hispida (Thunb) Cogn. (2n = 2x = 24)], an annual herbaceous plant belonging to the Cucurbitaceae family, which originates in China and East India, is renowned as a high-potassium, low-sodium vegetable (Han et al., 2013). Wax gourd fruit is favored by consumers for its high nutritional value and refreshing taste. Consuming wax gourd in winter can not only help regulate body temperature but also replenish nutrients. Wax gourd boasts wide adaptability, resistance to storage, and high yields, allowing for year-round availability in the market, which consequently contributes to increasing the annual income of farmers (Yan et al., 2021).
A genetic map is an indispensable tool for breeding studies. With the advent of high-throughput sequencing technology, significant strides have been made in the selection of SNP markers to construct high-density genetic maps for wax gourd. Jiang et al. (2015) pioneered the construction of the first high-density genetic map of wax gourds using specific-locus amplified fragment sequencing (SLAF-seq) technology. Their map incorporated 4,607 SNP markers distributed across 12 linkage clusters, with a total map distance of 2,172.86 cM and an average inter-marker distance of 0.49 cM. Su et al. (2022) harnessed whole-genome resequencing technology to establish another high-density genetic map of wax gourd. Their map featured 3,720 bin markers derived from 323,107 SNPs, with a total map distance of 1,243.87 cM and an average inter-marker spacing of 0.33 cM. Nonetheless, in comparison to vegetables such as tomatoes and radishes (Gonda et al., 2019; Tao et al., 2022), the construction of genetic maps for wax gourds lags behind. Notably, all existing wax gourd maps have been established using temporary separation populations. Thus, expediting the breeding process of wax gourds by employing permanent separation populations to construct high-density genetic maps is imperative to strengthen the foundational basis for genetic research on wax gourds.
Soluble solids in fruits and vegetables predominantly encompass soluble sugars in the pulp and are a crucial metric for evaluating fruit sweetness and maturity (Beckles, 2012). The taste and flavor of wax gourd depend greatly on the soluble solids content (SSC), which is also an essential factor affecting the quality of processed products such as wax gourd candies and wax gourd beverages. SSC can be used as an indicator of fruit ripeness in the production process. However, studies investigating this trait are limited. W. Wu et al. (2022) were the first to locate the regulatory gene for SSC in wax gourd, BhSSC2.1, via a combination of quantitative trait loci (QTL) localization analysis and bulked segregant analysis (BSA)-seq. This gene encodes an NADP-dependent malic enzyme and is situated on Chr2. Xue et al. (2022) employed transcriptome sequencing technology to identify two genes, AGA2 (Bhi03G001926) and SUS (Bhi12G001032), which exhibit strong correlations with sugar accumulation in wax gourds. Furthermore, regulatory sites for SSC have also been identified in watermelon (Cheng et al., 2016; Ren et al., 2014), melon (Argyris et al., 2017; Ramamurthy & Waters, 2015), and tomato (Kimbara et al., 2018; Levin et al., 2000).
Current research on wax gourd fruit quality has primarily focused on its appearance (Ma et al., 2021; Yan et al., 2022). SSC in the wax gourd is a complex quantitative trait with some loci that require full characterization. In this study, 105 recombinant inbred line (RIL) populations and parents were used as the test material, and whole-genome resequencing technology to develop SNPs and indels for the construction of a high-density genetic map was leveraged. We identified QTLs by correlating phenotypic data for wax gourd SSC with this map, predicted candidate genes by referencing the wax gourd reference genome, and validated and identified significant candidate genes using RT-qPCR and gene cloning technology. The findings of this study furnish a theoretical foundation for breeding high-SSC wax gourd varieties.
. Material and method
. Plant materials
RIL population (F8) comprising 105 lines was established using MY-1, a low-SSC variety, as the female parent and GX-7, a high-SSC variety, as the male parent. Plant materials were sourced from Nanning Konon Seedling Co., Ltd., located in Nanning, Guangxi, China. Both the parental and RIL populations were sown at the Nanning Konon Seedling Co., Ltd. farm on July 22, 2022, following a randomized block design with three replicates. Each plot contained ten plants, with row and plant spacings set at 1.5 and 0.5 m, respectively, and they were managed in accordance with standard field production practices.
. Construction of a high-density genetic map
Young leaves from the parental and RIL populations were collected for DNA extraction using a Plant Genomic DNA Extraction Kit (Solarbio Science, Beijing, China). DNA quality was assessed using 1.2% agarose gel electrophoresis. High-quality DNA samples were subjected to sequencing using an Illumina HiSeq PE150 sequencing platform. Sequencing data with splice sequences or low-quality bases were eliminated to ensure data quality. Subsequently, these sequencing data were aligned to the wax gourd reference genome GX-19 (unpublished) using BWA-MEM (Jung & Han, 2022). Markers were developed and screened using GATK v.3.7 (McKenna et al., 2010). The division of bin markers was carried out using the sliding window algorithm. Finally, MSTMap software (Y. Wu et al., 2008) was employed to calculate the genetic map distances between markers and construct a genetic map. The quality of the genetic map was assessed by the collinearity of the genetic map with the reference genome GX-19. The sequencing files of the RIL populations in this study can be found in the online database (https://db.cngb.org/search/?q=CNP0004715). The name and accession number of the online database are CNSA and CNP0004715.
. Collection of phenotypic data
In the parental and RIL populations, hand-pollination was performed at the flowering stage, and pollination dates were recorded on tags. Wax gourds displaying uniform growth as well as freedom from disease and insect pests were selected for SSC measurements. SSC measurements were conducted at 5, 10, 15, 20, 25, and 30 DAP (days after pollination) for the parental fruits and at 20 DAP for the RIL population fruits. Wax gourd pulp was homogenized using a high-speed homogenizer and filtered using gauze. The SSC was quantified using a handheld digital saccharimeter, with five fruits sampled from each plot and three measurements taken per wax gourd to calculate an average value. Data were statistically analyzed using GraphPad Prism v.9.0 (https://www.graphpad-prism.cn).
. QTL mapping
Using a combination of the high-density genetic map and phenotypic data, QTL analysis was performed using the Composite Interval Mapping method in the QTL Cartographer v.1.17j (Wang et al., 2012), and the maximum limit of detection (LOD) threshold was determined using the permutation test (1,000 times, paired 0.05).
. Candidate gene prediction analysis
Genes bearing non-synonymous mutated SNP sites were identified based on the sequence information of the wax gourd reference genome GX-19. Multiple databases (GO, KEGG, and NR) were consulted alongside the wax gourd reference genome GX-19 annotation file to annotate the functions of genes with non-synonymous mutant SNPs. The specific expression of candidate genes in the parental pulp was analyzed via RT-qPCR.
. Candidate gene RT-qPCR analysis
Pulp from the parent fruit at each stage was harvested and stored at −80 °C. RNA was extracted from the pulp using an Eastep Super Total RNA Extraction kit (Promega, Beijing, China), and reverse transcription was conducted using a PrimeScriptTM RT Master Mix (Perfect Real Time) kit. Primer sequences for the internal reference gene CAC (Bch05G003650) and the candidate genes were designed using Premier 5 (Table S1). PCR reaction solutions were prepared for RT-qPCR according to the TB Green®; Premix Ex TaqTM II (Tli RNaseH Plus) instructions. Relative gene expression was assessed using the 2−Δ Δ CT method, and graphs were generated using GraphPad Prism v.9.0 (https://www.graphpad-prism.cn).
. Candidate gene sequence analysis
Primers were designed based on the coding sequences of the candidate genes (Table S1). RNA from the parental pulp was reverse transcribed using a 5× All-In-One RT MasterMix kit. The target gene was amplified using a 2× Phanta Max Master Mix kit (Vazyme, Nanjing, China). A 1.2% agarose gel was prepared to detect the PCR products. The target products were subsequently isolated and purified using an Axyprep DNA Gel Extraction Kit (Axyprep, Union City, CA, USA). Expression vectors were constructed following the manufacturer’s instructions for the CV16-Zero Background TOPO-Blunt Cloning Kit (Adderall; Beijing, China). These vectors were transformed using Trans5α competent cells (Escherichia coli), and monoclonal colonies were selected for sequencing. Sequence comparison and analysis of the sequencing results were performed using DNAMAN v.9.0 (https://www.lynnon.com/dnaman.html).
. Results
. Constructing a high-density genetic map of wax gourd
We conducted whole-genome resequencing of the MY-1, GX-7, and 105 RIL populations. In MY-1 and GX-7, we generated 30.50 Gbp and 29.16 Gbp of clean bases, respectively. The RIL population produced a total of 2,957.06 Gbp of clean bases, with an average of 28.19 Gbp per line. The Q30 ratios for both the parental and RIL populations exceeded 83%. In comparison to the wax gourd reference genome GX-19, the coverage depths for MY-1 and GX-7 were 29.82X and 26.71X, respectively, while the average coverage depth for the RIL population was 27.64X (Table S2). A total of 1,289,176 SNPs and indels were identified between the parents, and 1,256,985 SNPs and indels were filtered and employed for binning. Eventually, we constructed a high-density genetic map containing 956 bin markers while having 12 linkage groups corresponding to the chromosomes one by one (Table S3). The total map spanned 1,357.15 cM, with an average spacing of 1.53 cM (Figure 1A, Table 1). Notably, the linkage groups with the highest and lowest number of bin markers were LG10 and LG7, containing 153 and 15 bin markers, respectively. Collinearity analysis between the high-density genetic map generated in this study and the reference genome GX-19 demonstrated consistency for most markers in each linkage group, affirming the high quality of the map for QTL mapping (Figure 1B).
Figure 1
(A) Distribution of bin markers in the linkage group. (B) Analysis of collinearity between genetic mapping and reference genomes.
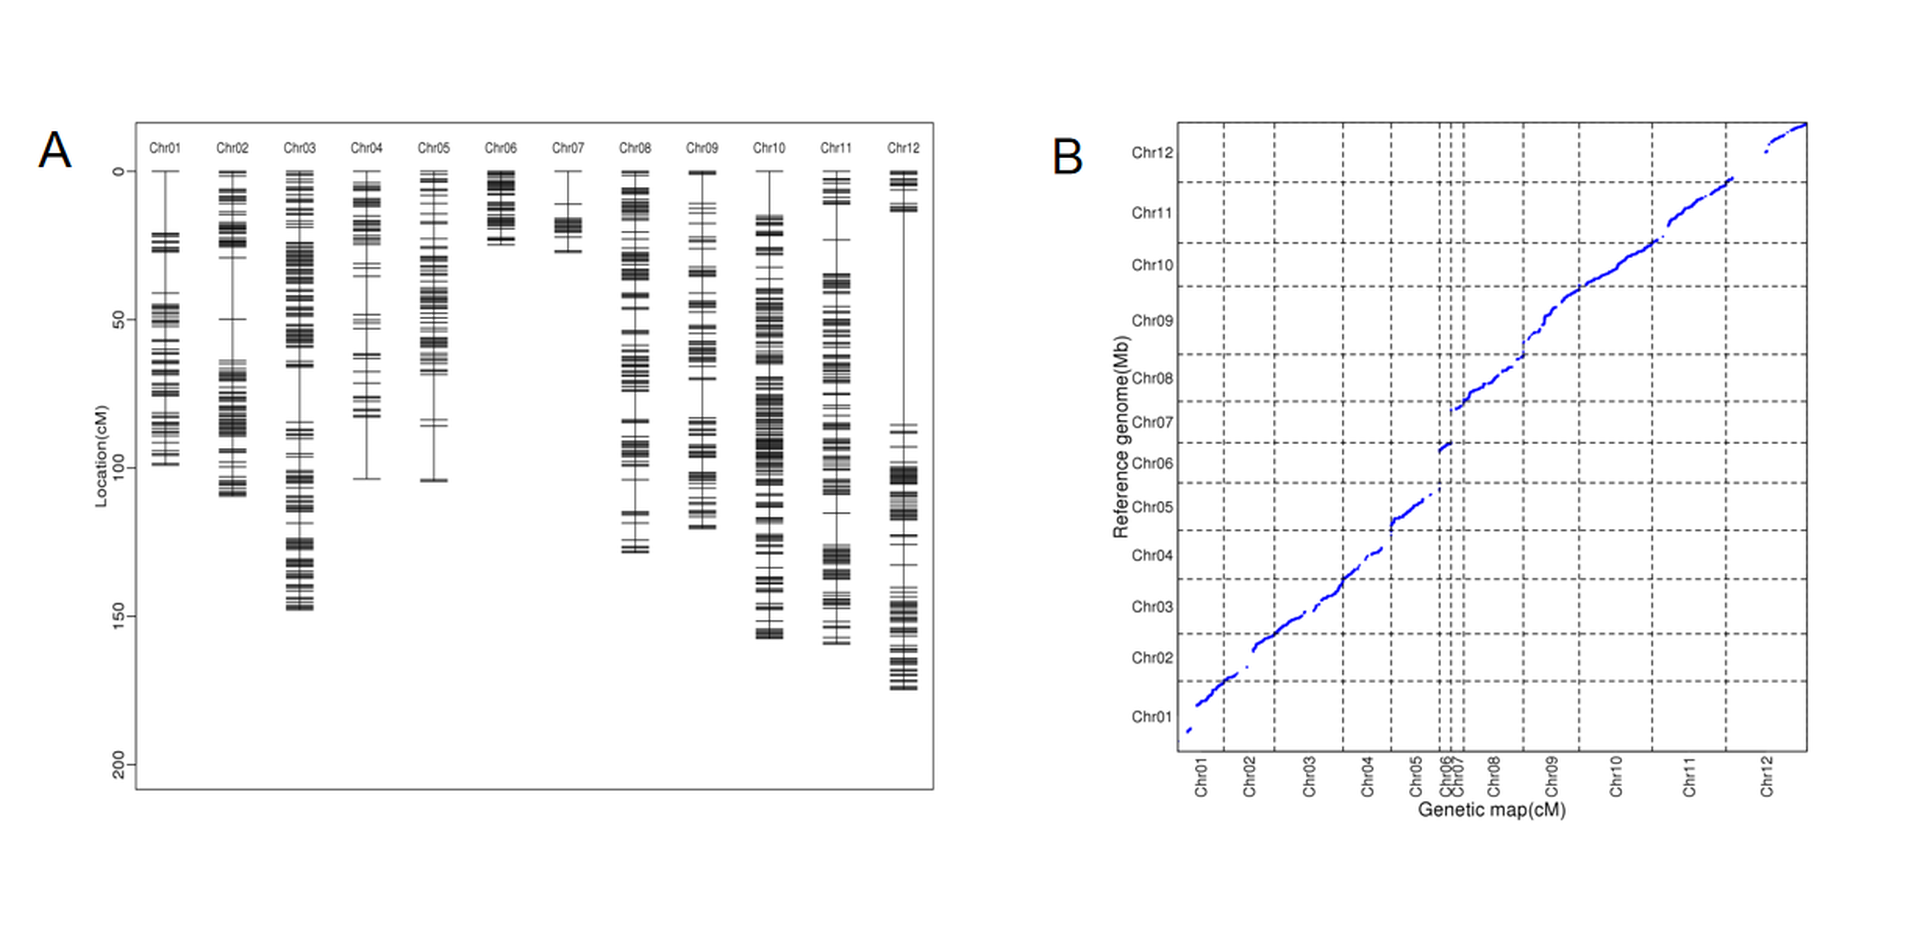
Table 1
Genetic mapping information.
. Phenotypic data of parental and RIL populations
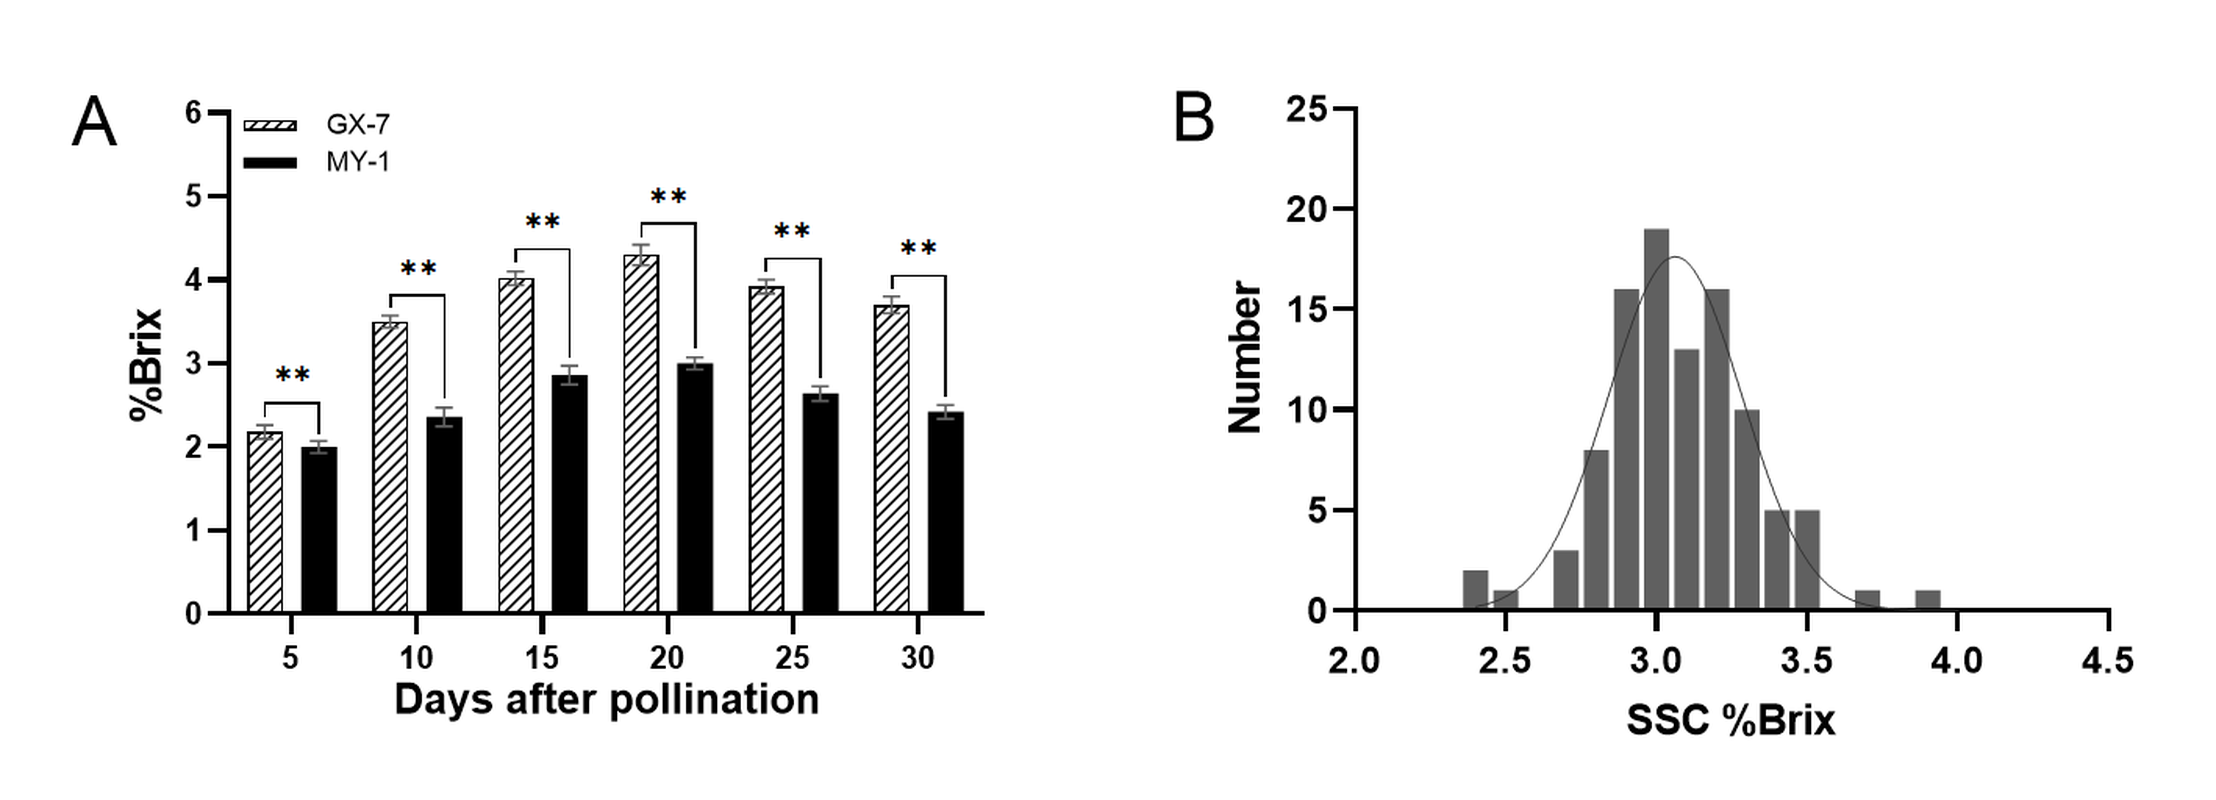
We examined the SSC of the two parental varieties at different fruit developmental stages (Figure 2A). Our results indicated that the SSC of GX-7 significantly exceeded that of MY-1 at all stages. Both parents displayed a consistent pattern of SSC variation, characterized by an initial increase followed by a decrease, reaching the highest values at 20 DAP (4.3% Brix for GX-7 and 3.0% Brix for MY-1). The most substantial phenotypic difference between the parents occurred at 20 DAP, leading us to select fruits at this stage for investigating the SSC of the RIL population. The SSC within the RIL population ranged from 2.43% to 4.05% Brix, with instances of super-parental phenomena in certain individuals. Furthermore, the SSC distribution within the wax gourd population exhibited a normal distribution (Figure 2B), making it suitable for use in QTL localization studies.
. QTL localization of SSC in wax gourd
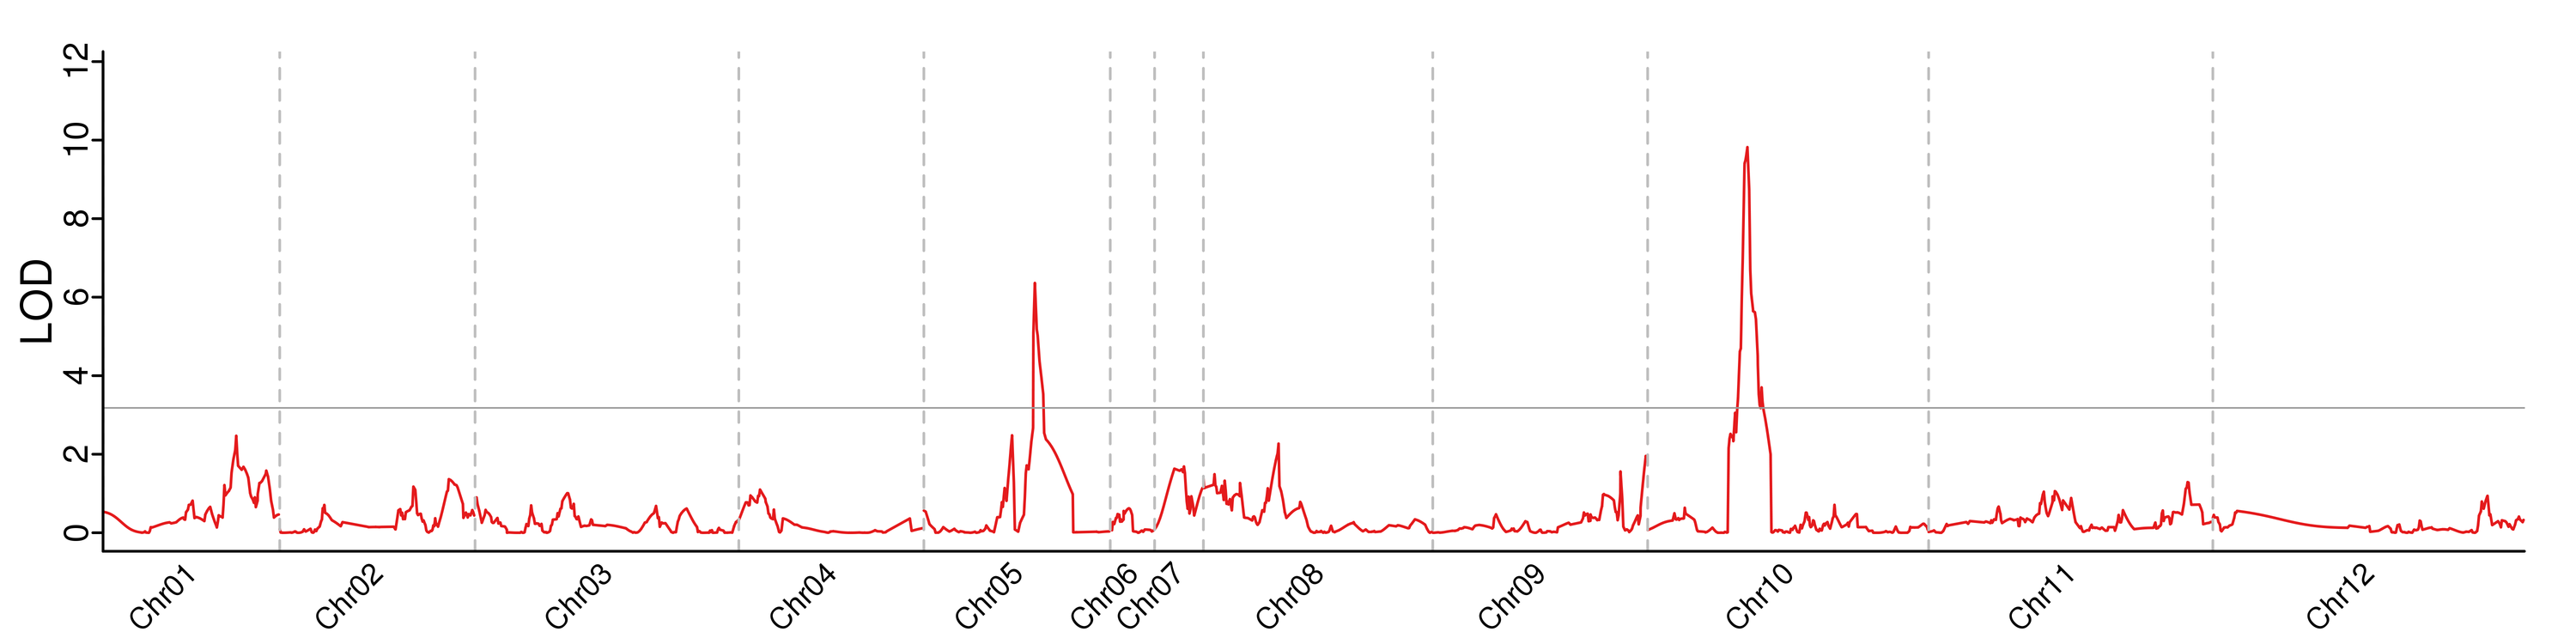
By integrating the genetic map with phenotypic data, we detected two QTLs on Chr5 and Chr10 (Figure 3). qSSC5 had a LOD value of 6.36 and a phenotypic contribution of 17.7%, with an additive effect value of −0.1432. qSSC10 displayed a LOD value of 9.82 and a phenotypic contribution of 28.9%, with an additive effect value of −0.1586 (Table 2). These results indicated that qSSC10 exhibited a higher contribution rate and effect value, signifying its role as a major effect of QTL for SSC in wax gourds.
. qSSC10 candidate gene analysis
qSSC10 was located at 54.28–55.91cM (1.63 cM). A total of 31 annotated genes were identified within qSSC10 by referencing the wax gourd reference genome GX-19. Using a biparental polymorphism analysis strategy, we screened ten candidate genes for non-synonymous coding SNPs (Table 3). Bioinformatics analysis revealed that the proteins encoded by these genes had diverse functions, including involvement in plant growth, phytohormone anabolism, and responses to biotic and abiotic stresses. The analysis of relative gene expression among the parents highlighted significant differences in the expression of Bch10G006650 between MY-1 and GX-7 (Figure 4). Bch10G006650 encodes a Class III peroxidase gene, which plays a crucial role in reactive oxygen species (ROS) production and scavenging, responses to various stresses, and stomatal closure, among other functions. Stomatal closure influences photosynthetic efficiency, directly impacting sugar accumulation in fruit. Consequently, we postulated that Bch10G006650, herein named BhSSC10.1, is a pivotal candidate gene for regulating SSC in wax gourds.
Figure 4
Expression of candidate genes within the qSSC10 interval at 20 DAP. Data represents means ± SE (n = 3), **p-value < 0.01.
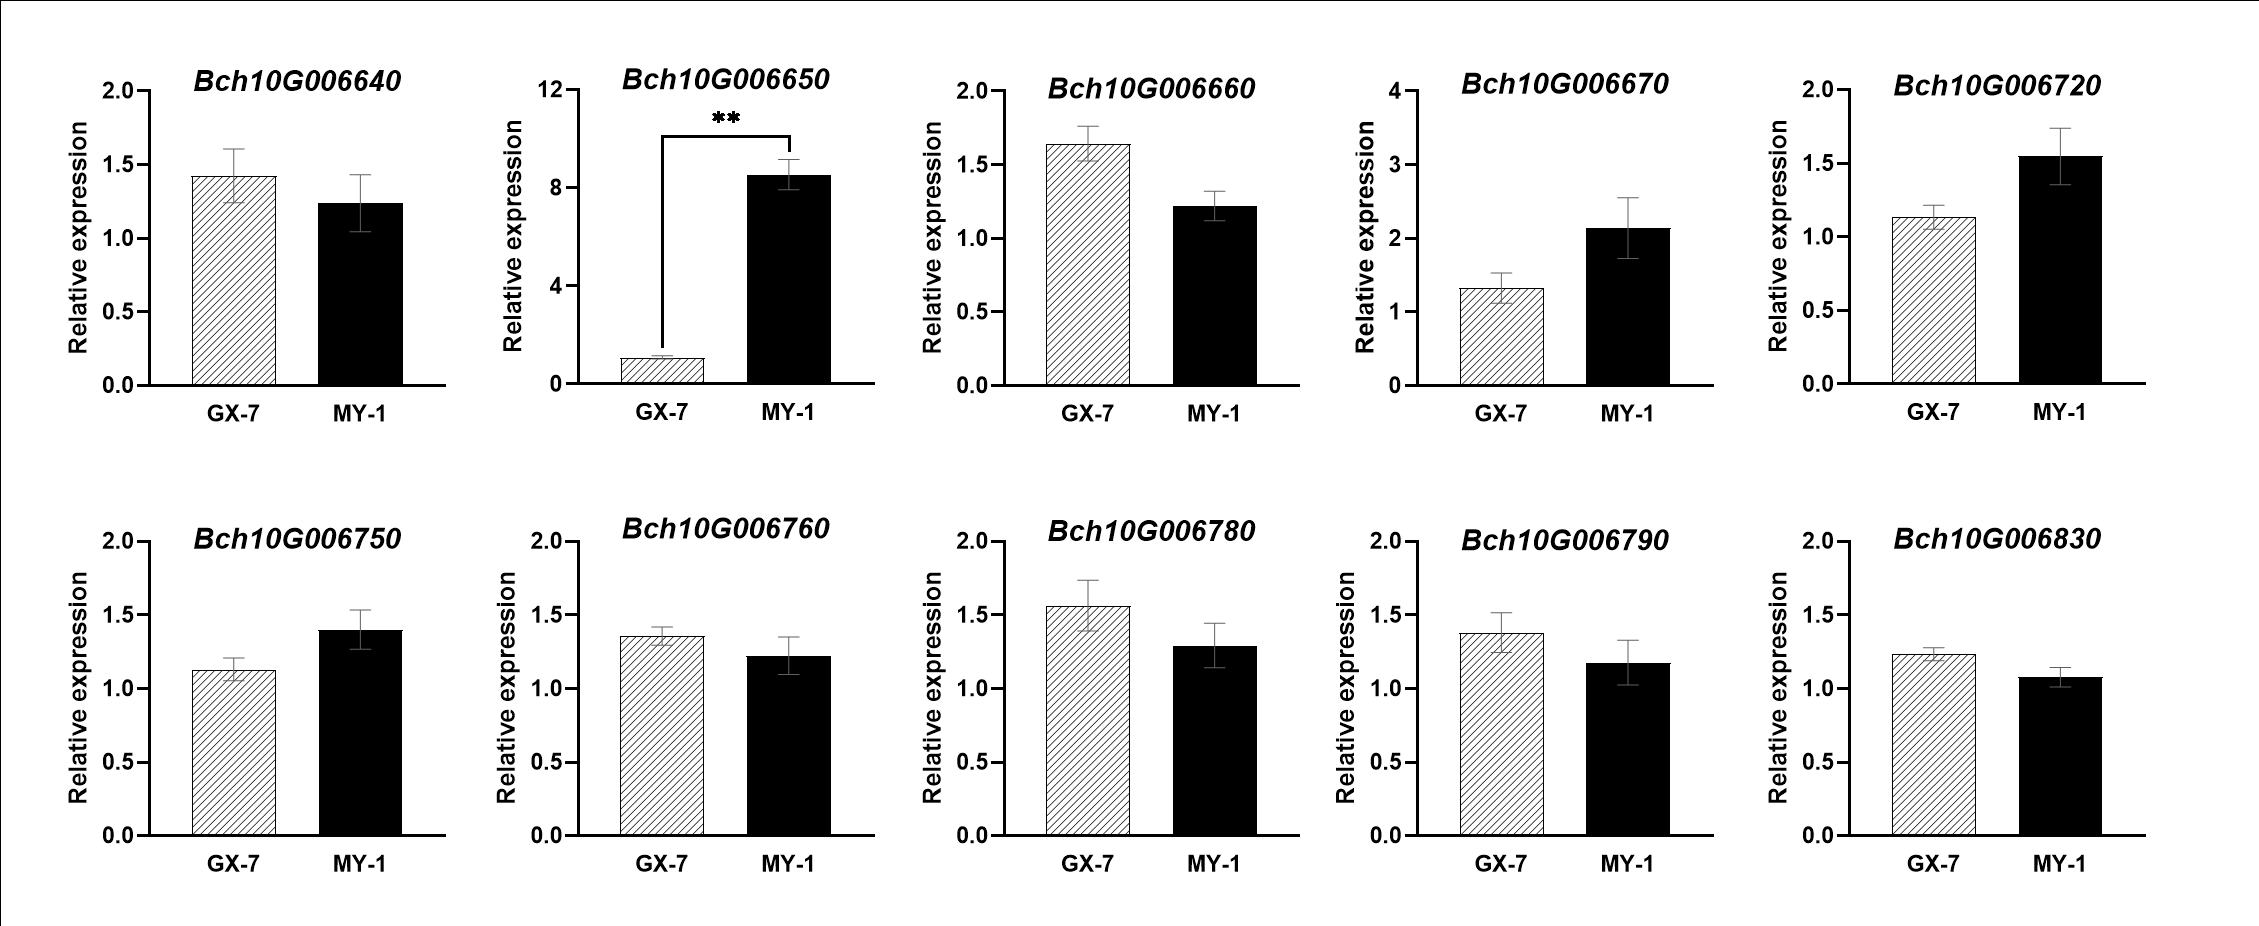
Table 3
Annotation of non-synonymous mutated genes within the qSSC10 interval.
. Sequence comparison and expression analysis of BhSSC10.1 candidate genes
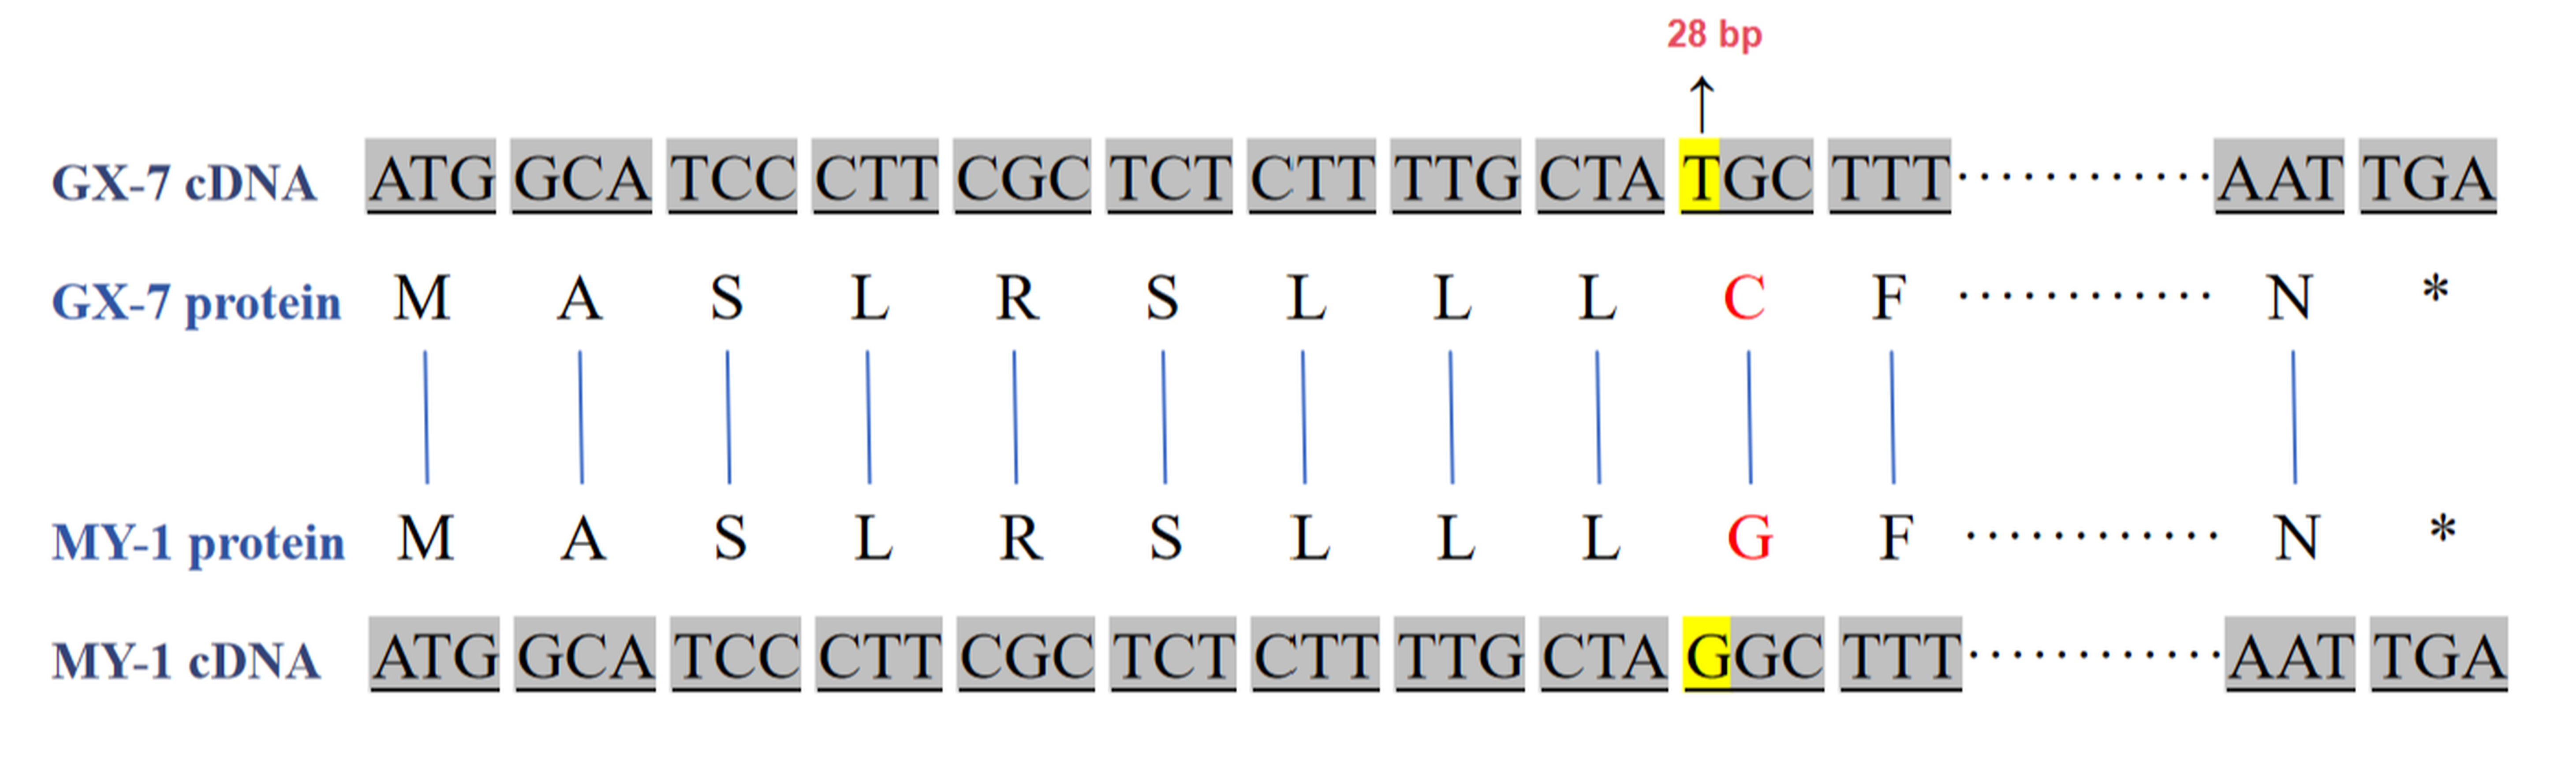
Cloning techniques were utilized to analyze the sequences of candidate genes. The results revealed consistency between the sequencing results and the whole-genome sequencing data (Figure S1). The complete Coding DNA Sequence (CDS) of BhSSC10.1 spanned 915 bp. The sequence in GX-7 matched the reference genome GX-19. In MY-1, a mutation was observed in the coding sequence involving a non-synonymous nucleotide change at the 28th base position, transitioning from thymine (T) to guanine (G), resulting in an amino acid change from cysteine (C) to glycine (G) (Figure 5).
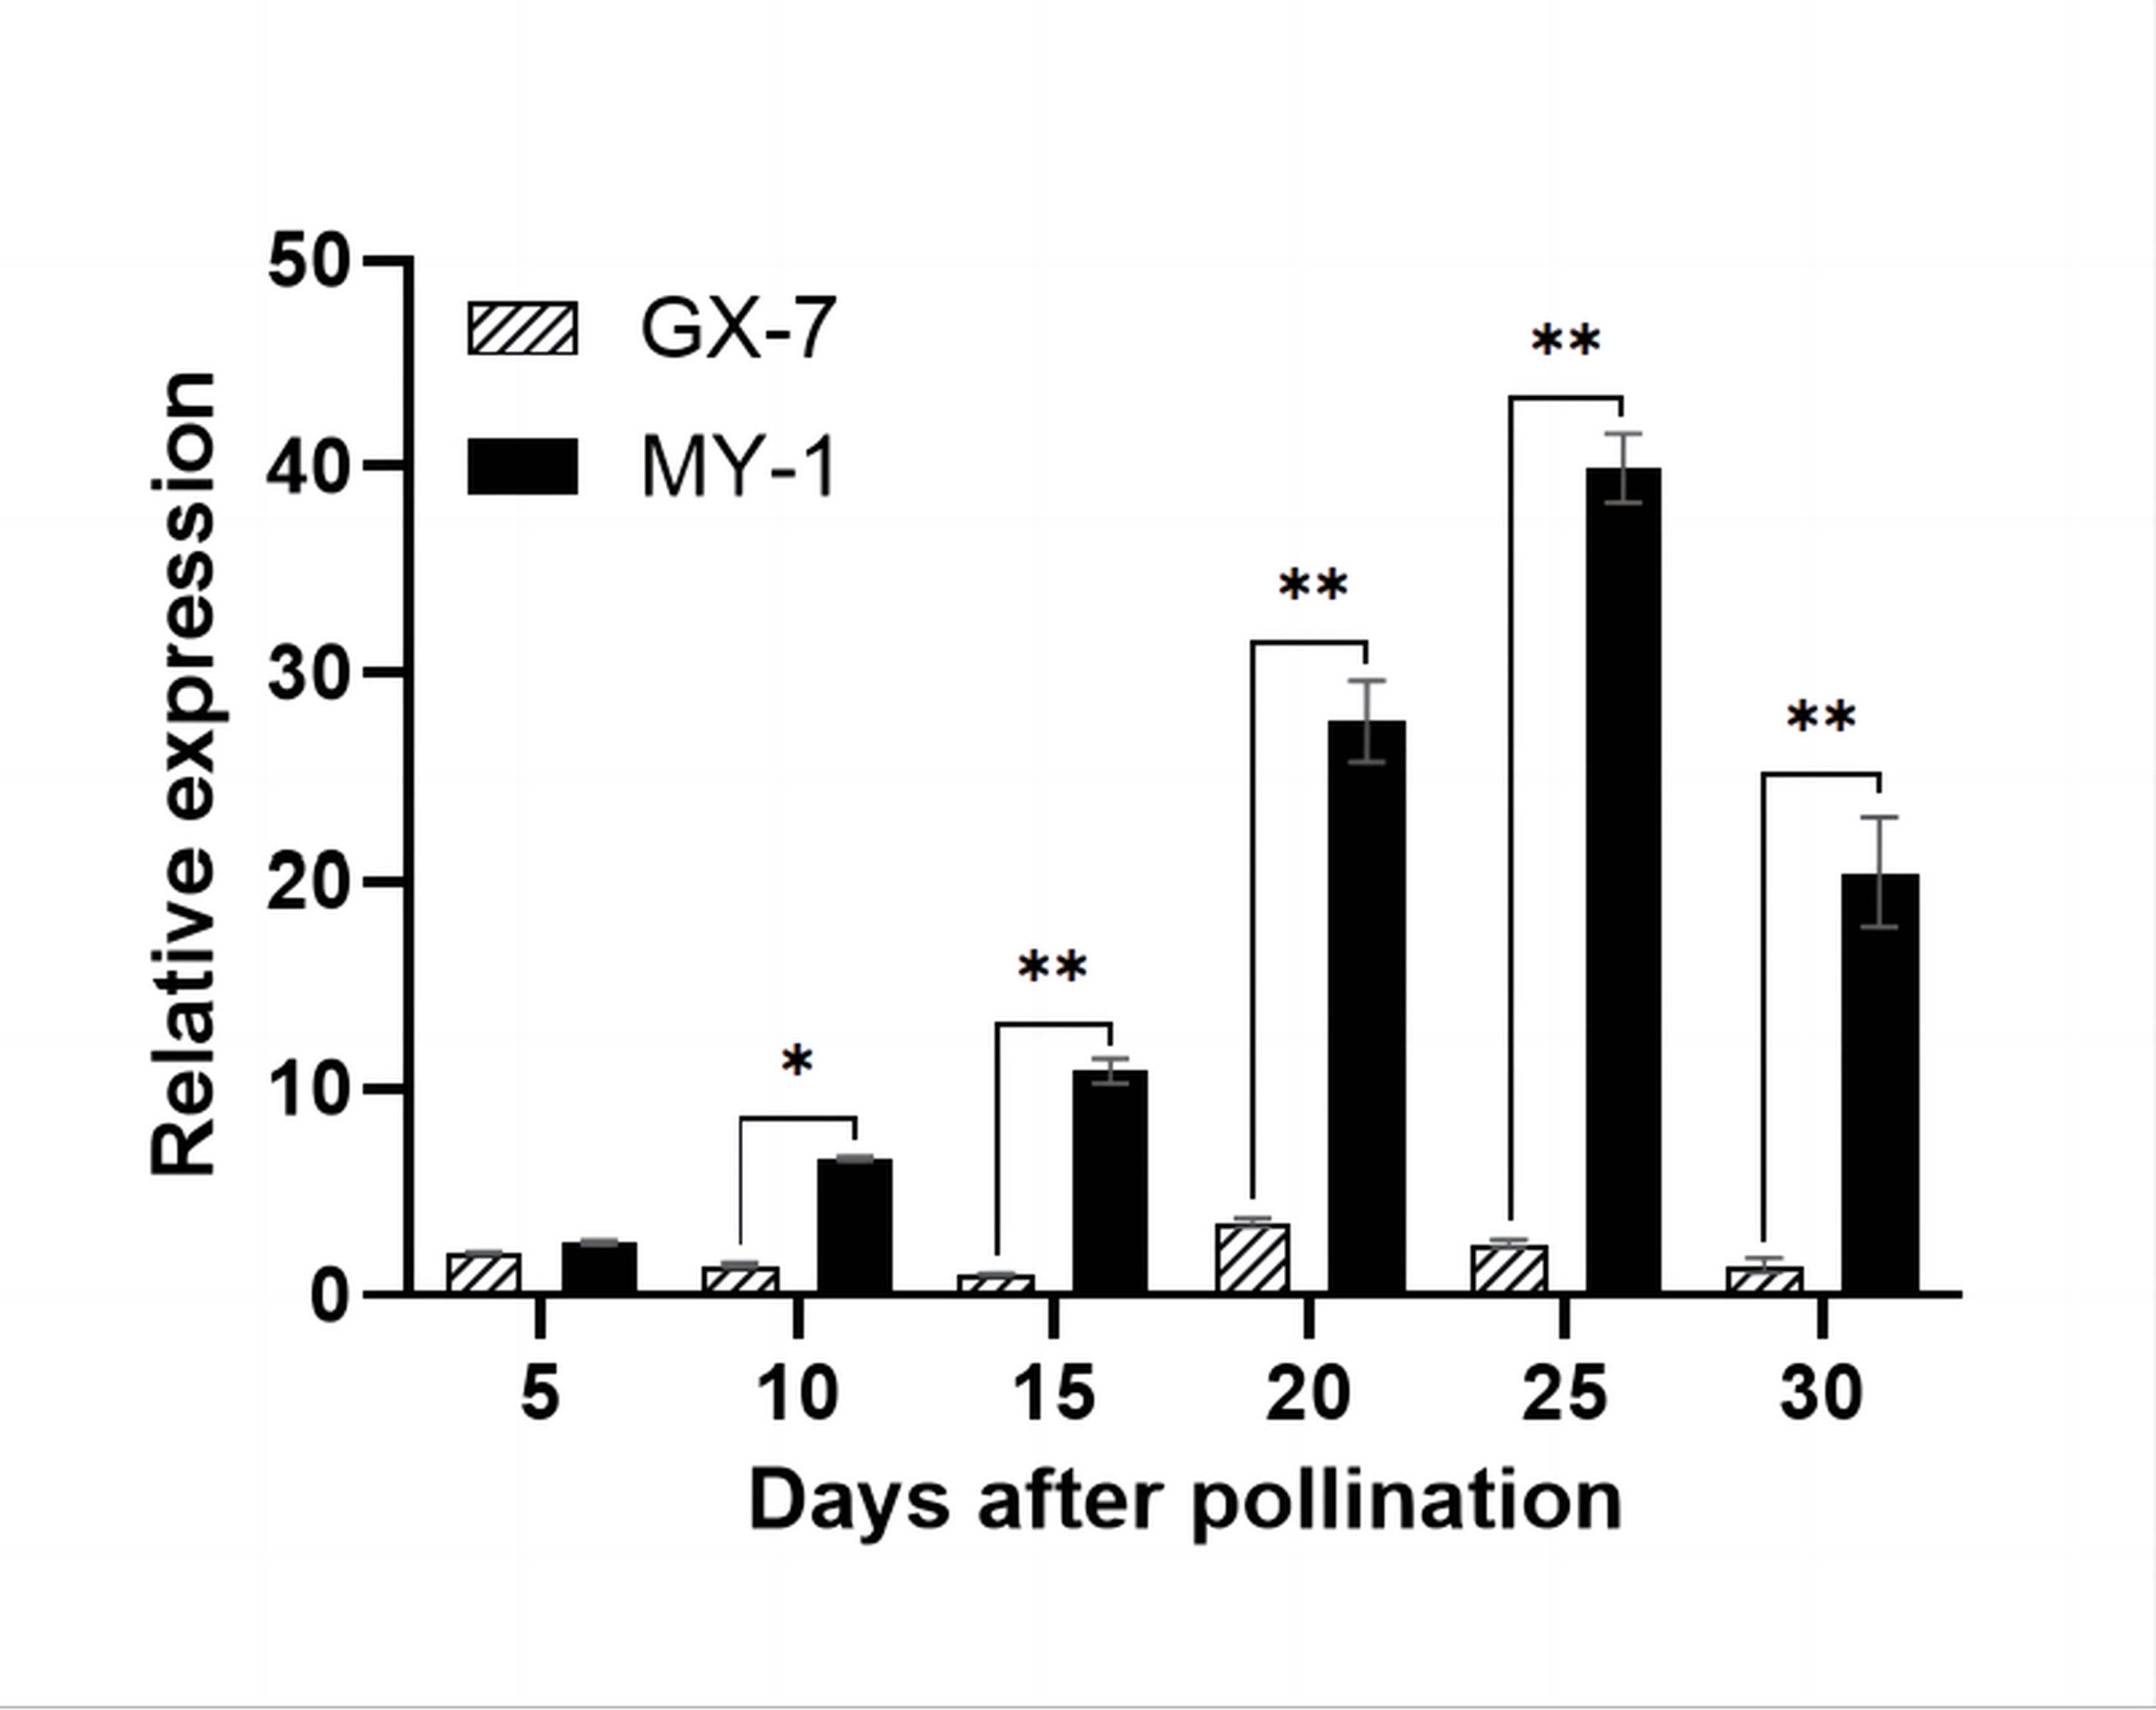
The expression analysis of BhSSC10.1 in parental pulp samples (5, 10, 15, 20, 25, and 30 DAP) via RT-qPCR demonstrated significantly higher expression in MY-1 than in GX-7, except at 5 DAP (Figure 6). Throughout the fruit development of MY-1, BhSSC10.1 expression continuously increased, reaching its peak at 25 DAP and then decreasing. In contrast, during the fruit development of GX-7, BhSSC10.1 expression in the fruit pulp remained low. These findings, coupled with the results of the sequence analysis, support the hypothesis that BhSSC10.1 is a critical candidate gene for regulating SSC in wax gourds.
. Discussion
. Genetic maps constructed using RIL populations of wax gourd and bin markers facilitated more precise localization of QTL loci
Genetic maps play a crucial role in identifying QTL loci (W. Xie et al., 2010). The choice of mapping populations and molecular markers significantly impacts the precision of QTL analysis (Yu et al., 2011). In this study, the high-generation purebred inbred lines GX-7 and MY-1 were selected as parents. The SSC of GX-7 was significantly higher than that of MY-1 at all periods of fruit growth, and thus, GX-7 had better flavor compared to MY-1. In the context of wax gourd breeding, where research started relatively late, most high-density genetic maps have relied on the F2 population due to its ease of construction. However, RIL populations, characterized by increased recombination events resulting from multiple meiotic divisions before strain purity is achieved, offer more accurate QTL localization (Burr et al., 1988). RIL populations have also been effectively utilized in other Cucurbitaceae species. For instance, Y. Sun et al. (2022) developed a high-density genetic map for cucumbers, spanning 1,111.41 cM, employing 129 RIL populations. Similarly, Branham et al. (2018) constructed a high-density genetic map for melons, covering a total map distance of 1,670.50 cM, using 172 RIL populations. In contrast to conventional molecular markers, bin markers contain multiple SNP loci that remain unaltered by recombination, thereby increasing marker density in genetic maps (Ge et al., 2022). Su et al. (2022) constructed the first high-density bin marker genetic map for wax gourds, utilizing 195 F2 populations with a total map length of 1,243.87 cM. In a departure from previous methods, this study proposes the use of RIL populations to construct a bin marker genetic map for wax gourds, offering significant advantages for QTL localization studies of complex traits in wax gourds. Yang et al. (2023) have used the genetic map constructed in this study to fine mapping a gene (BhHLS1) controlling seed size on Chr10 in wax gourd.
. Mechanism of the BhSSC10.1 gene regulating SSC in wax gourd
SSC is an intrinsic quality trait in wax gourds. Currently, only W. Wu et al. (2022) have identified a QTL on Chr2 with an LOD threshold of 6.454 and a phenotypic contribution of 16.033%. The primary determinant of SSC in wax gourds is soluble sugar, which directly impacts their quality (D. Xie et al., 2009). The main source of sugar accumulation in fruits is closely tied to the transport and distribution of photosynthetic products (L. Sun et al., 2022). In this study, a high-density genetic map of wax gourds was constructed using the RIL population, leading to the discovery of two new additive QTLs, qSSC5 and qSSC10, with their potentiating alleles originating from maternal MY-1. The phenotypic contribution of qSSC10-1 reached 28.9%, indicating that the major gene regulating SSC in wax gourd is probably within this interval. In qSSC10, it was observed that the relative expression of the gene encoding Class III peroxidase BhSSC10.1 (Bch10G006650) exhibited significant differences among the parental strains, making it an important candidate gene for regulating SSC in wax gourd. Sequence comparison between MY-1 and GX-7 based on the wax gourd reference genome GX-19 revealed a non-synonymous coding SNP in MY-1, resulting in an amino acid shift from cysteine (C) to glycine (G). Liu (2021) found that mutations in the GSM6 gene, encoding a Class III peroxidase, led to the glucose-sensitive mutant gsm6, characterized by an accumulation of ROS and an impact on chloroplast development. A wealth of studies underscores the role of cell wall peroxidase-induced extraplastidial ROS production in regulating stomatal movement (Arnaud et al., 2017; He et al., 2020; Mammarella et al., 2015). Ju et al. (2017) demonstrated that the DEWAX transcription factor, when overexpressed, upregulated the expression of class III peroxidase genes, closely linked to ROS accumulation. Hence, in this study, we speculated that a non-synonymous mutation in the CDS sequence of MY-1 resulted in the repression of the transcription of BhSSC10.1, which reduced the photosynthetic efficiency of MY-1, thereby affecting the accumulation of SSC. However, unraveling these intricate regulatory mechanisms necessitates further investigation. As a next step, studies should focus on determining the lines that differ in qSSC5 and not in qSSC10 among 105 RIL populations. Additionally, we will use these findings to construct populations and facilitate further investigations into genes controlling qSSC5.
. Supplementary material
The following supplementary materials are available for this article:
Table S1. Primers used in this study.
Table S2. Statistical table of sequencing data and coverage.
Table S3. Statistical Bin marker information.
Figure S1. Comparison of CDS sequences of BhSSC10.1 of GX-7, MY-1, and GX-19.
