. Introduction
Mitochondria are the hubs for energy supply and biosynthesis of various lipids in cells. Mitochondria in plants play an important role in respiration, metabolism, and programmed cell death (Klupczyńska et al., 2022). The structural rearrangement of mitochondrial DNA (mtDNA) can even lead to plant cytoplasmic male sterility (CMS) (Møller et al., 2021; Spinelli & Haigis, 2018). In many cases, CMS has been traced to the introduction of sterility-associated open reading frames (ORFs) and/or the generation of chimeric ORFs in the mtDNA (Liberatore et al., 2016). These changes may result from spontaneous mutations or the alloplasmic or cybrid conditions in crosses between distinct populations or species with differing cytotypes (Chen & Liu, 2014). As a special and easily available genetic marker, the mitochondrial (mt) genome is widely used for research in phylogeny, population genetics, crop breeding, medicine, and ecology (Johnston & Burgstaller, 2019; Kazama et al., 2019; Knoop, 2004; Mahapatra et al., 2021; Yang et al., 2021).
To date, 28,782 mt genomes of various organisms (1,568, 692, 179, and 562, respectively, from animals, fungi, protists, and plants) are collected in NCBI (https://www.ncbi.nlm.nih.gov/genome/browse#!/organelles/2023/07/21). Among the reported mt genomes of plants, 512, 44, and six are of land plants, green algae, and other plants, respectively. Nearly all animal mt genomes are approximately 16.5 kb in length, whereas plant mt genomes are approximately 20 kb to 2 Mb in length (Alverson et al., 2011; Friis et al., 2021; Morley & Nielsen, 2017). However, the coding sequences in plant mtDNA are highly conserved, with a relatively similar number of basic functional genes, including 24 core genes and 17 variable genes (Morley & Nielsen, 2017). Besides the typical circular structure, plant mtDNA may exhibit linear, branched, multicircular, or a combination of multiple structures (Kozik et al., 2019). Numerous repeat sequences of various lengths and numbers exist in the mtDNA of higher plants and account for 2%–60% of total mtDNA (Arrieta-Montiel & Mackenzie, 2011). The complex structure of mt genome in plants is mainly attributed to the high-frequency intra- and intermolecular recombination of mtDNA mediated by the repeat sequences (Christensen, 2013; Wynn & Christensen, 2019). It has been proved that the repeat sequences are not redundant; they contain abundant genetic information and are specific to the species composition. This information could be used as genetic traits to study the evolutionary relationships of species, and these repeat sequences play an important role in regulating gene expression, transcription, and physiological metabolism (Gualberto & Newton, 2017; Wu et al., 2014).
Lycium barbarum is an important medicinal and food crop from the Solanaceae family. It is widely distributed in northwest and northeast China, in which the Ningxia region boasts of cultivating the top-quality L. barbarum, with “Ningqi No.1” and “Ningqi No.5” as the main cultivars. “Ningqi No.5” is a male-sterile natural mutant of “Ningqi No.1” and is the main species for hybrid breeding currently. At present, the nuclear (PRJNA640228) (Cao et al., 2021) and chloroplast (NC_041110) genomes (Jia et al., 2018) of L. barbarum are published in NCBI. However, its mt genome has not been reported. In this study, the anthers of “Ningqi No.1” (fertile line) and “Ningqi No.5” (male sterile line) were used to study the mtDNA of L. barbarum. The size, configuration, gene number, repeat sequence, RNA-editing sites, and gene transfer in the mt genome of L. barbarum were analyzed. A phylogenetic tree was constructed to analyze the taxonomic status and genetic relationship between L. barbarum and other plants. To the best of our knowledge, this is the first study in which mt genome from Lyciumwas reported. These results may provide additional information for a better understanding of the mt genome of the Solanaceae family.
. Material and methods
. Sample collection and sequence assembly
“Ningqi No.1” and “Ningqi No.5” plants (4–5-year-old) were selected from Quanxing L. Barbarum Plantation, located in Zhongning, Ningxia, China. The flower buds were collected. Immediately, the anthers were peeled off on dry ice, placed in a centrifuge tube, immediately frozen in liquid nitrogen, and stored at −80 °C. Total genomic DNA was obtained from the anthers using the CTAB (Hexadecyltrimethy Ammonium Bromide) method. The DNA purity was assessed using 1.0% agarose gel electrophoresis. Further, libraries of short- and long-reads were constructed.
The short-read library was obtained as follows: (1) The genomic DNA was fragmented via mechanical interruption, and the fragmented DNA was purified using the magnetic bead method (VAHTSTM DNA Clean Beads, No. N411-03); (2) End Prep Mix 4 (VAHTSTM Universal DNA Library Pren Kit, No. ND607-02) was added to the purified product. After mixing and centrifugation, PCR was performed for end repair and 3′ end A reaction; (3) Further, rapid ligation buffer 2 (VAHTSTM Universal DNA Library Pren Kit, No. ND607-02), adaptor, and ligase were added to the above reaction product. The ligation reaction was conducted in a PCR, and the ligation fragments were sorted using the magnetic bead method; (4) The sequencing library was constructed after PCR amplification and PCR product purification. The qualified library (concentration ≥ 1 ng/µL, fragment center value: 430–530 bp, average value: 420–580 bp, and peak type: normal distribution was sequenced on the Illumina xten platform. The long-read library was obtained as follows: (1) High-quality 10 µg nucleic acid was taken. Blue Pippin (Sagescience) automatic nucleic acid fragment recovery system was used to screen the required fragment size; (2) NEBNext FFPE DNA Repair Mix and NEBNext Ultra II End Repair/dA-Tailing Module were used to complete the end repair of nucleic acid fragments and 3′ end A reaction; (3) The Ligation Sequencing Kit 1D (PM) (Nanopore, No.SQK-LSK109) was used to complete the connection of the sequencing adapter; (4) The qualified library (concentration > 8 ng/µL) was sequenced on the Nanopore ONT platform [used the PromethION Flow Cells (Nanopore, FLO-PRO002) chip, ran the MinKnow software in the PromethION48 sequencer to start the test, 72 h by default].
Sequence assembly was conducted by Genepioneer Biotechnologies (Nanjing, China) as follows: (1) The original three-generation data were compared with the reference gene sequence (plant mt core gene, https://github.com/xul962464/plant_mt_ref_gene) via alignment software minimap2 (v2.1, parameter: -t 20 -ax map-ont, others with default parameter) (Li, 2018), and the sequence with a length >50 bp was screened as the candidate sequence in the alignment. The sequence with more aligned genes (one sequence contains multiple core genes) and higher alignment quality (covering more complete core genes) was selected as the seed sequence. The Perl single-line command was used to cluster and extend the seed sequences. Further, all the third-generation sequencing reads of the mt genome can be obtained by multiple clustering and extension of the seed sequences; (2) The third-generation assembly software Canu (v2.1, parameter: -correct genomeSize = 500 k useGrid=false -nanopore-raw) (Koren et al., 2017) was used to correct the third-generation reads obtained above, and bowtie2 (v2.3.5.1, parameter: -very-sensitive-local -p 20) (Langmead & Salzberg, 2012) was used to align the second-generation data to the corrected reads; (3) The Unicycler (v0.4.8, default parameter) (Wick et al., 2017) was used to compare the above second-generation data and the corrected third-generation data for concatenation. The methods to distinguish mtDNA from cpDNA (chloroplast DNA) and nuclear genomic DNA mainly depended on their sequencing depth and the long overlap between sequences. If the nuclear genome was sequenced at a depth of 1×, the chloroplast genome could reach hundreds or even thousands of sequencing depth because of multiple copies of the chloroplast in each cell and multiple chloroplast genomes in each chloroplast. The mt genome had fewer copies than the chloroplast genome but more copies than the nuclear genome; therefore, its sequencing depth was usually in the dozens. In addition, if a sequence had a long overlap and similar depth with the identified mt genome sequence, it would also be considered as the mt genome sequence. Unicycler software could automatically remove (convert) low-depth sequences which may belong to the nuclear genome. Therefore, the contig sequences were clear and did not have many branches. In the case of the homologous sequence, the lower-depth sequence belonged to the mt genome, and the higher-depth sequence belonged to the chloroplast genome. This made it easy to manually delete sequences from the chloroplast genome. Finally, based on the results generated by Unicycler software, the circular mt genome was manually adjusted as the final L. barbarum mt genome sequence.
. Annotation of the L. barbarum mt genome
The protein-coding and rRNA genes in the mt genome of L. barbarum were annotated using Blast to align with the published plant mt sequences as references. The tRNAs were identified using tRNAscanSE (v2.0) (Chan & Lowe, 2019). Open Reading Frame Finder (https://www.ncbi.nlm.nih.gov/orffinder/) was used to predict and annotate the ORFs; the shortest length was set to 102 bp, and redundant sequences and sequences with overlap with known genes were excluded. Sequence alignments greater than 300 bp were annotated to the NR library. To obtain more accurate annotation results, the above results were checked and manually corrected. The physical circular map was drawn using OGDRAW (Greiner et al., 2019).
. Analysis of repeat sequences
Simple sequence repeats (SSR) were identified using MISA software (v1.0, parameter: 1–10 2–5 3–4 4–3 5–3 6–3; 1–10 means one base repeats 10 times or more; 2–5 means two base repeats 5 times or more, and so on) (Beier et al., 2017). Tandem repeats were identified using TRF software (trf409.linux64, parameter: 277 80 10 50 2000 -f-d-m) (Benson, 1999). Dispersed repeats were identified using Blastn (v2.10.1, parameters: word size 7, e value 1e−5, redundancy removed, and tandem repeats removed).
. Analysis of relative synonymous codon usage and RNA editing site
The Relative Synonymous Codon Usage (RSCU) of protein-coding sequences in the mt genome of L. barbarum was analyzed using CAIcal (Puigbò et al., 2008).
Bowtie 2 (v2.3.5.1) (Langmead & Salzberg, 2012) was used for aligning the transcriptome data obtained in our previous study to the CDS sequence of mt genes, and the alignment reads were selected using samtools (v1.9) (Danecek et al., 2021). Based on the alignment information, the script program get_coverage.pl (https://github.com/xul962464/get_coverage_from_bam, parameter: -q 41) was used to count the coverage of the reliable alignment reads at each site. If the alignment base on the transcriptome was different from the genome and the depth reached 3×, the site was considered a potential RNA editing site.
. Analysis of DNA migration
The transfer of sequences from chloroplast and nuclear genomes to the mt genome was studied. mtDNA of L. barbarum was considered as the query sequence to search homologous sequences with the nuclear (PRJNA640228) and chloroplast (NC_041110) genomes using Blastn (v2.10.1, parameters: e-value: 1e−5).
. Phylogenetic tree construction
Phylogenetic analysis was performed using the mt genomes of L. barbarum and 22 other plants (belonging to Solanaceae, Poaceae, Convolvulaceae, Asteraceae, Fabaceae, Brassicaceae, Ginkgoaceae, and Pinaceae families) downloaded from GenBank (Clark et al., 2016). Ginkgo biloba and Pinus taeda were considered as outgroups. GenBank accessions of mt genomes of 23 plants are listed in Table S1. In total, sequences of 29 protein-coding genes (PCGs) (atp1, atp4, atp6, atp8, atp9, ccmB, ccmC, ccmFC, ccmFN, cob, cox1, cox2, cox3, matR, nad1, nad2, nad3, nad4, nad4L, nad5, nad6, nad7, nad9, rpl16, rpl5, rps12, rps13, rps3, and rps4) shared by more than 70% species were selected for multi-sequence alignment using MAFFT (v7.427, auto mode) (Katoh & Standley, 2013). TrimAI (v1.4. rev15, Parameter: gt 0.7) (Capella-Gutiérrez et al., 2009) was used to trim the aligned sequences. Further, the maximum likelihood tree was constructed with RAXML (v8.2.10) (Stamatakis, 2014) using the GTRGAMMA model with a bootstrap of 1,000. The phylogenetic tree was finally visualized using iTOL (Letunic & Bork, 2021).
. Results
. Analysis of mt genome structure of L. barbarum
The clean data generated by second- and third-generation sequencing and their quality control standards are list in Table 1. The sequencing data were further assembled, which revealed identical mt genome sequence in both “Ningqi No.1” and “Ningqi No.5.” We named them together as L. barbarum mt genome (Genbank accession number: OP800905) in the follow-up analysis. The mt genome of L. barbarum is composed of an independent circular DNA with a size of 413,881 bp and GC content of 45.4%. A total of 61 genes were annotated, including 35 PCGs, 22 tRNA genes, four rRNA genes, and 2,242 ORFs with unknown functions (Figures 1 and S1).
Table 1
The sequencing data of “Ningqi No.1” and “Ningqi No.5”.
| Sample | Ningqi No. 1 | Ningqi No. 5 | |
|---|---|---|---|
| The second-generation sequencing clean data | ReadSum | 23,590,162 | 19,348,126 |
| BaseSum | 7,047,266,294 | 5,774,946,946 | |
| GC (%) | 37.79 | 37.86 | |
| Q20 (%) | 98.29 | 97.64 | |
| Q30 (%) | 94.85 | 93.11 | |
| Quality control standard | Fastp (version 0.20.0, https://github.com/opengene/fastp) software filters the raw data of second-generation sequencing, the filtration criteria are as follows: (1) truncate the sequencing linker in the Reads and the primer sequence. (2) Filter out the Reads with average quality value less than Q5. (3) Filter out the Reads with the N number more than 5. After the quality control of the above series, the high quality Reads called Clean Data can obtained. | ||
| The third-generation sequencing clean data | ReadSum | 2,302,635 | 1,696,050 |
| BaseSum | 21,977,390,105 | 18,957,117,581 | |
| Mean Read Length | 9,544 | 11,177 | |
| N50 Read Length | 13,536 | 14,277 | |
| Quality control standard | Filtlong (v0.2.1, https://link.zhihu.com/?target=https://github.com/rrwick/Filtlong) software filters the raw data of third-generation sequencing, parameter: –min_length 1000 –min_mean_q 7. | ||
Figure 1
Circular map of the mt genome of L. barbarum. Different classes of conserved protein-coding genes (PCGs) are assigned with distinct colors. The genes on the outside of the circle are transcribed in a clockwise direction. The genes shown inside the circle are transcribed in a counter-clockwise direction. The grey circle inside represents the GC content.
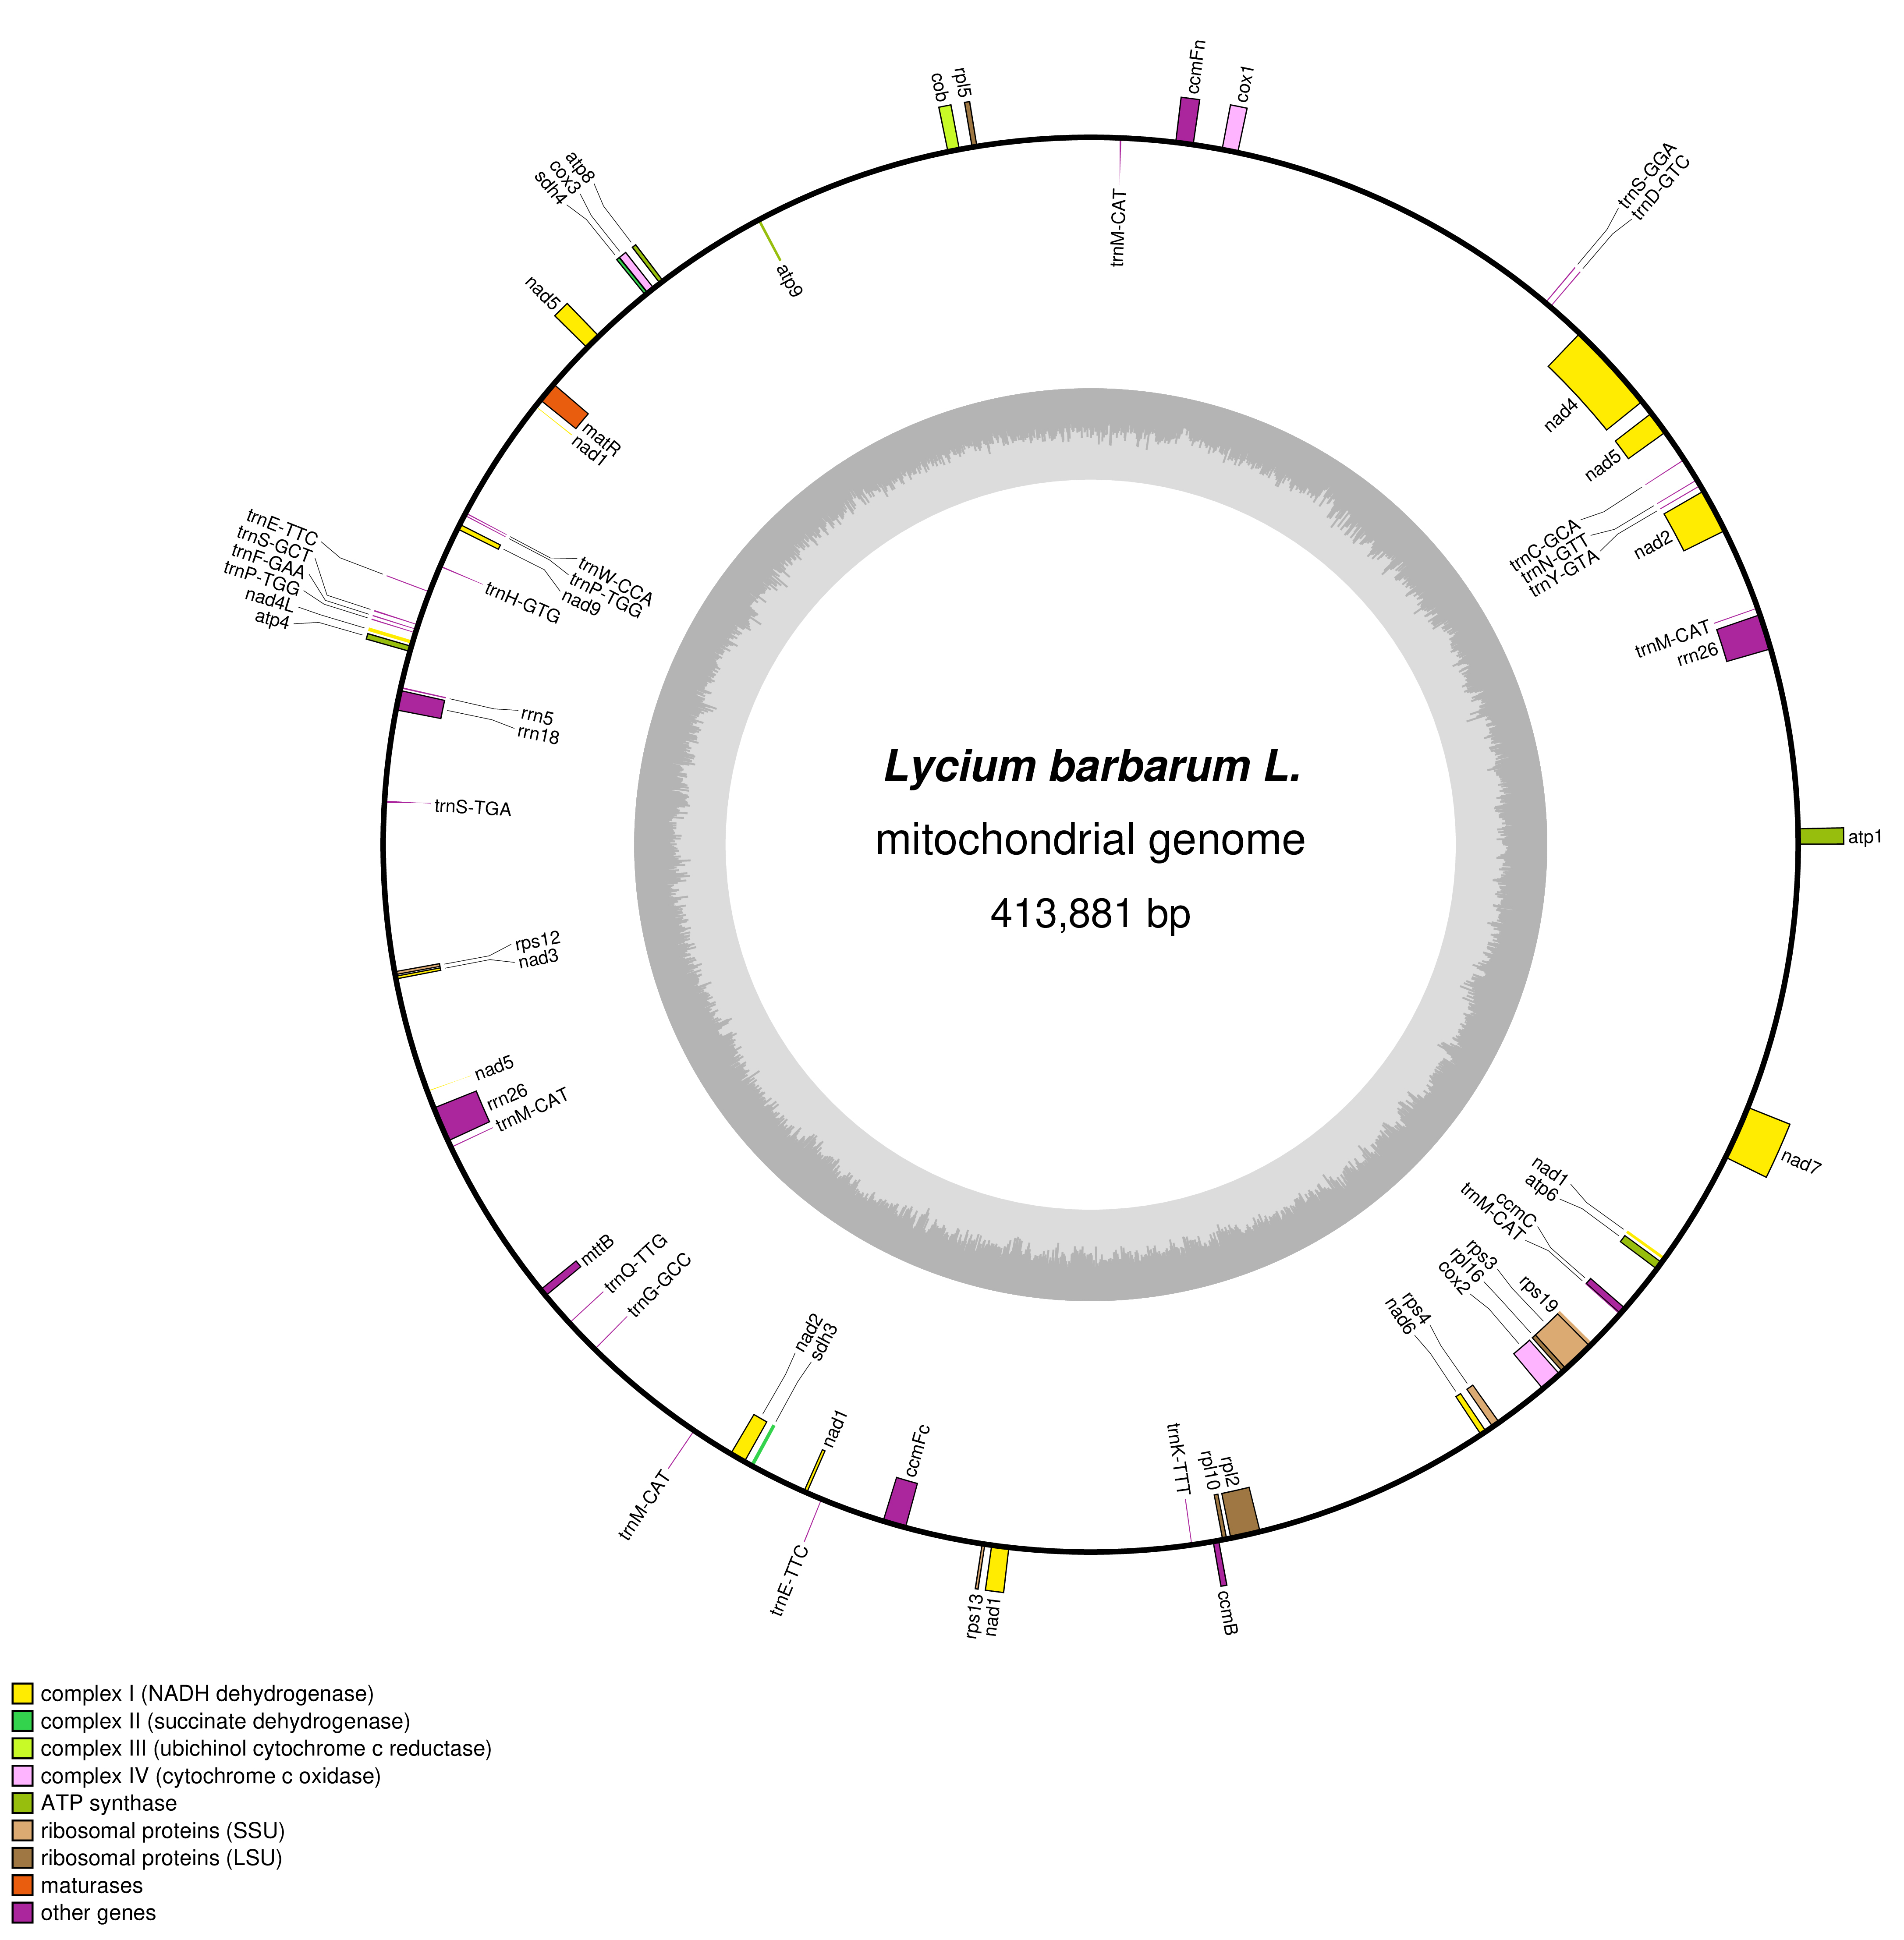
The length of PCGs varied from 234 (atp9) to 2,022 (matR) bp, consisting of NADH dehydrogenase (complex I), succinate dehydrogenase (complex II), ubichinol cytochrome c reductase (complex III), cytochrome C oxidase (complex IV), ATP synthase (complex V), cytochrome C biogenesis, ribosomal proteins, maturase protein, and transport membrane protein. The 35 PCGs were all single-copy genes. In total, nine PCGs contained introns; they were nad1, nad2, nad5 (four introns each); nad4, nad7 (three introns each); and cox2, ccmFC, rps3, and rpl2 (one intron each). Among 22 introns, 17 were cis-spliced, and five were trans-spliced. All PCGs used ATG as the start codon and TAA, TGA, and TAG as the stop codons (Table 2). rrn5 and rrn18 were single-copy genes, rrn26 had two copies, which were related to the recombination of repeat sequences. Overall, 22 tRNAs (trnE-TTC and trnP-TGG having two copies and trnM-CAT having five copies) were identified in the mt genome of L. barbarum and observed to transport 14 amino acids since more than one tRNA might transport the same amino acid with different codons.
Table 2
Gene annotation in the mt genome of L. barbarum.
. Analysis of base composition and codon preference
The base composition of the mt genome of L. barbarum was A (27.5%) > T (27.1%) > C (22.73%) > G (22.67%). The content of A+T (54.6%) was significantly higher than that of G+C (45.4%), indicating a preference for AT. Similarly, the content of A+T in PCGs (57.2%) was significantly higher than that of G+C (42.8%), whereas the content of A+T in tRNA and rRNA was close to that of G+C. AT-skew > 0 in the whole mt genome and rRNA indicated that the content of A was greater than that of T, and GC-skew > 0 in PCGs, tRNA, and rRNA indicated that the content of G was greater than that of C (Table 3).
Table 3
The nucleotide composition and skew values in L. barbarum.
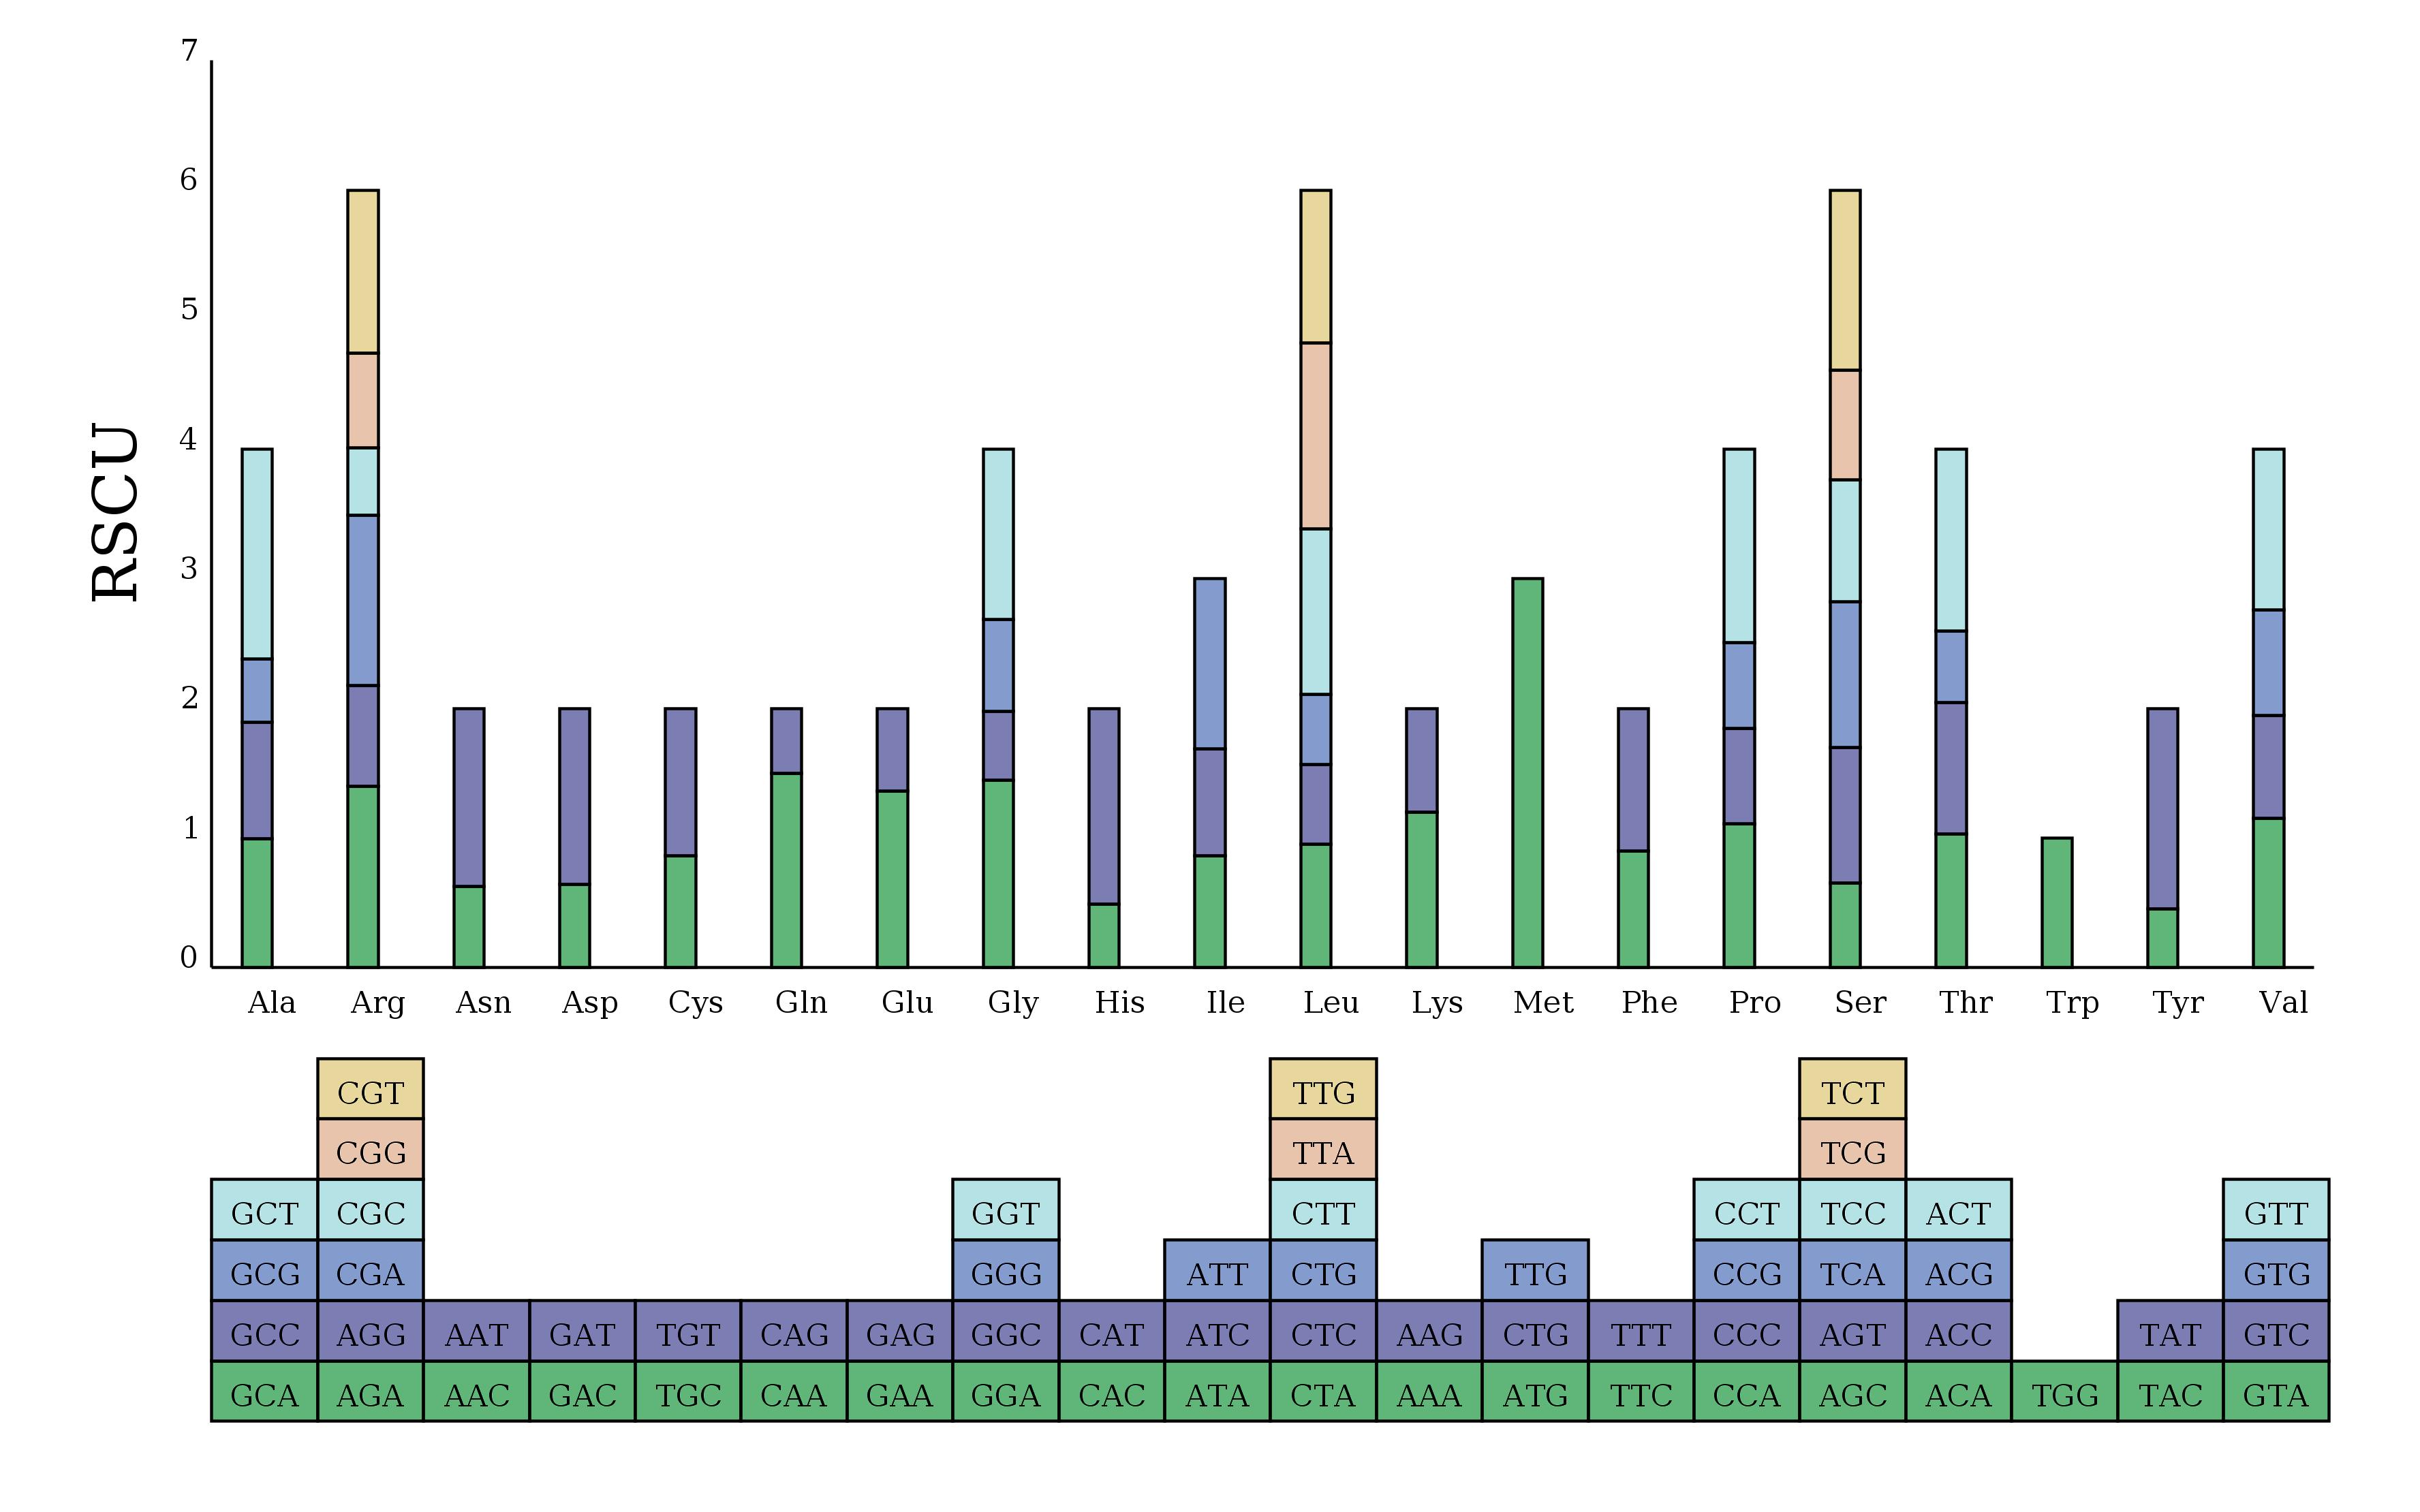
The codon preference of 35 PCGs was analyzed by calculating the RSCU values. Cal analysis suggested that there were 31 codons with RSCU > 1, among which 27 ended in A/T and four ended in G/C. Among these preferred codons, GCT (Ala), CAT (His), CAA (Gln), and TAT (Tyr) were used with the highest frequency, with their RSCU values > 1.5. mt PCGs of L. barbarum generally preferred A/T as the codon ending. The strong AT bias of the third codon is considered a common phenomenon in higher plants (Figure 2).
. Analysis of repeat sequences
mt genomes of plants have abundant repeat sequences. They can be classified into SSRs, tandem repeats, and dispersed repeats. In the mt genome of L. barbarum, the repetitive fragments had a total length of 69.97 kb, accounting for 16.9% of the mt genome. In total, 101 SSRs were observed, including 26 monomers (26%), 25 dimers (25%), nine trimers (9%), 38 tetramers (38%), and three pentamers (3%) but no hexamers (Figures 3A and 3B). Among them, monomers and dimers accounted for a large proportion (51%) and were enriched with A/T. The high A/T content in SSRs was consistent with that in the whole mt genome and PCGs in L. barbarum (54.6% and 57.2% counted in Table 3). In total, 16 pairs of tandem repeats were observed with length ranging from 12 to 44 bp. Except for “GGAAGTGTCCGATCATAGCACGAT (×2),” the other 15 pairs of tandem repeats were located in the intergenic spacer region (IGS) (Table 4). In total, 453 pairs of dispersed repeats were observed with length ranging from 30 to 4,232 bp (two pairs with a length of >1000 bp). Most of them were 30–59-bp short repeats (n = 346, 76%), and the medium and long repeats were few in number (Figure 3C).
Figure 3
Frequency distribution of sequence repeats in the mt genome of L. barbarum; (A) The proportion of SSR in the mt genome of L. barbarum; (B) Length of SSR and repeat sequences; (C) Number of dispersed repeats with different lengths.
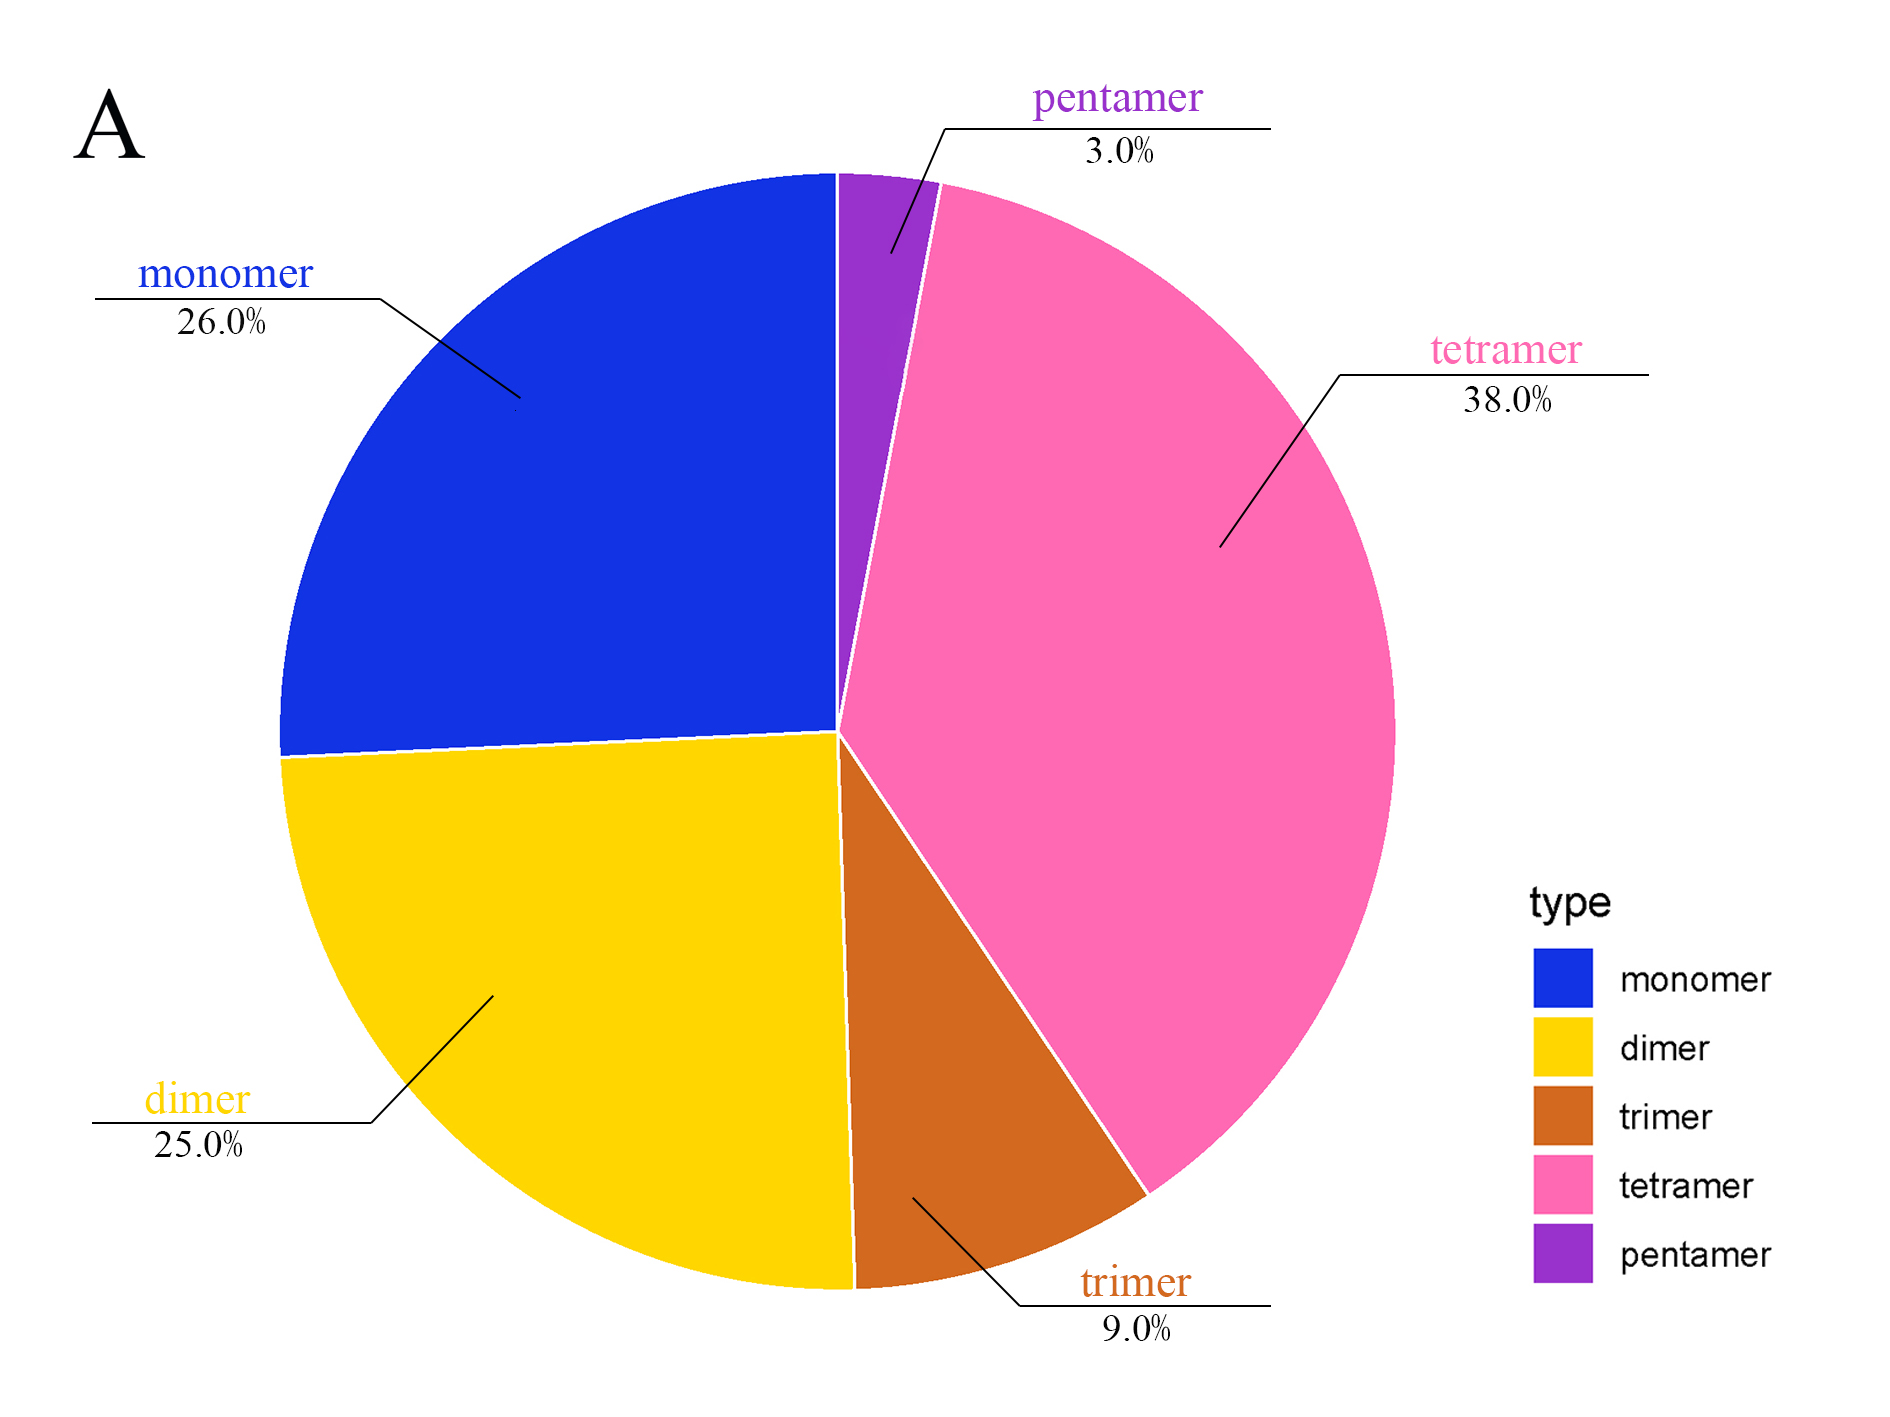
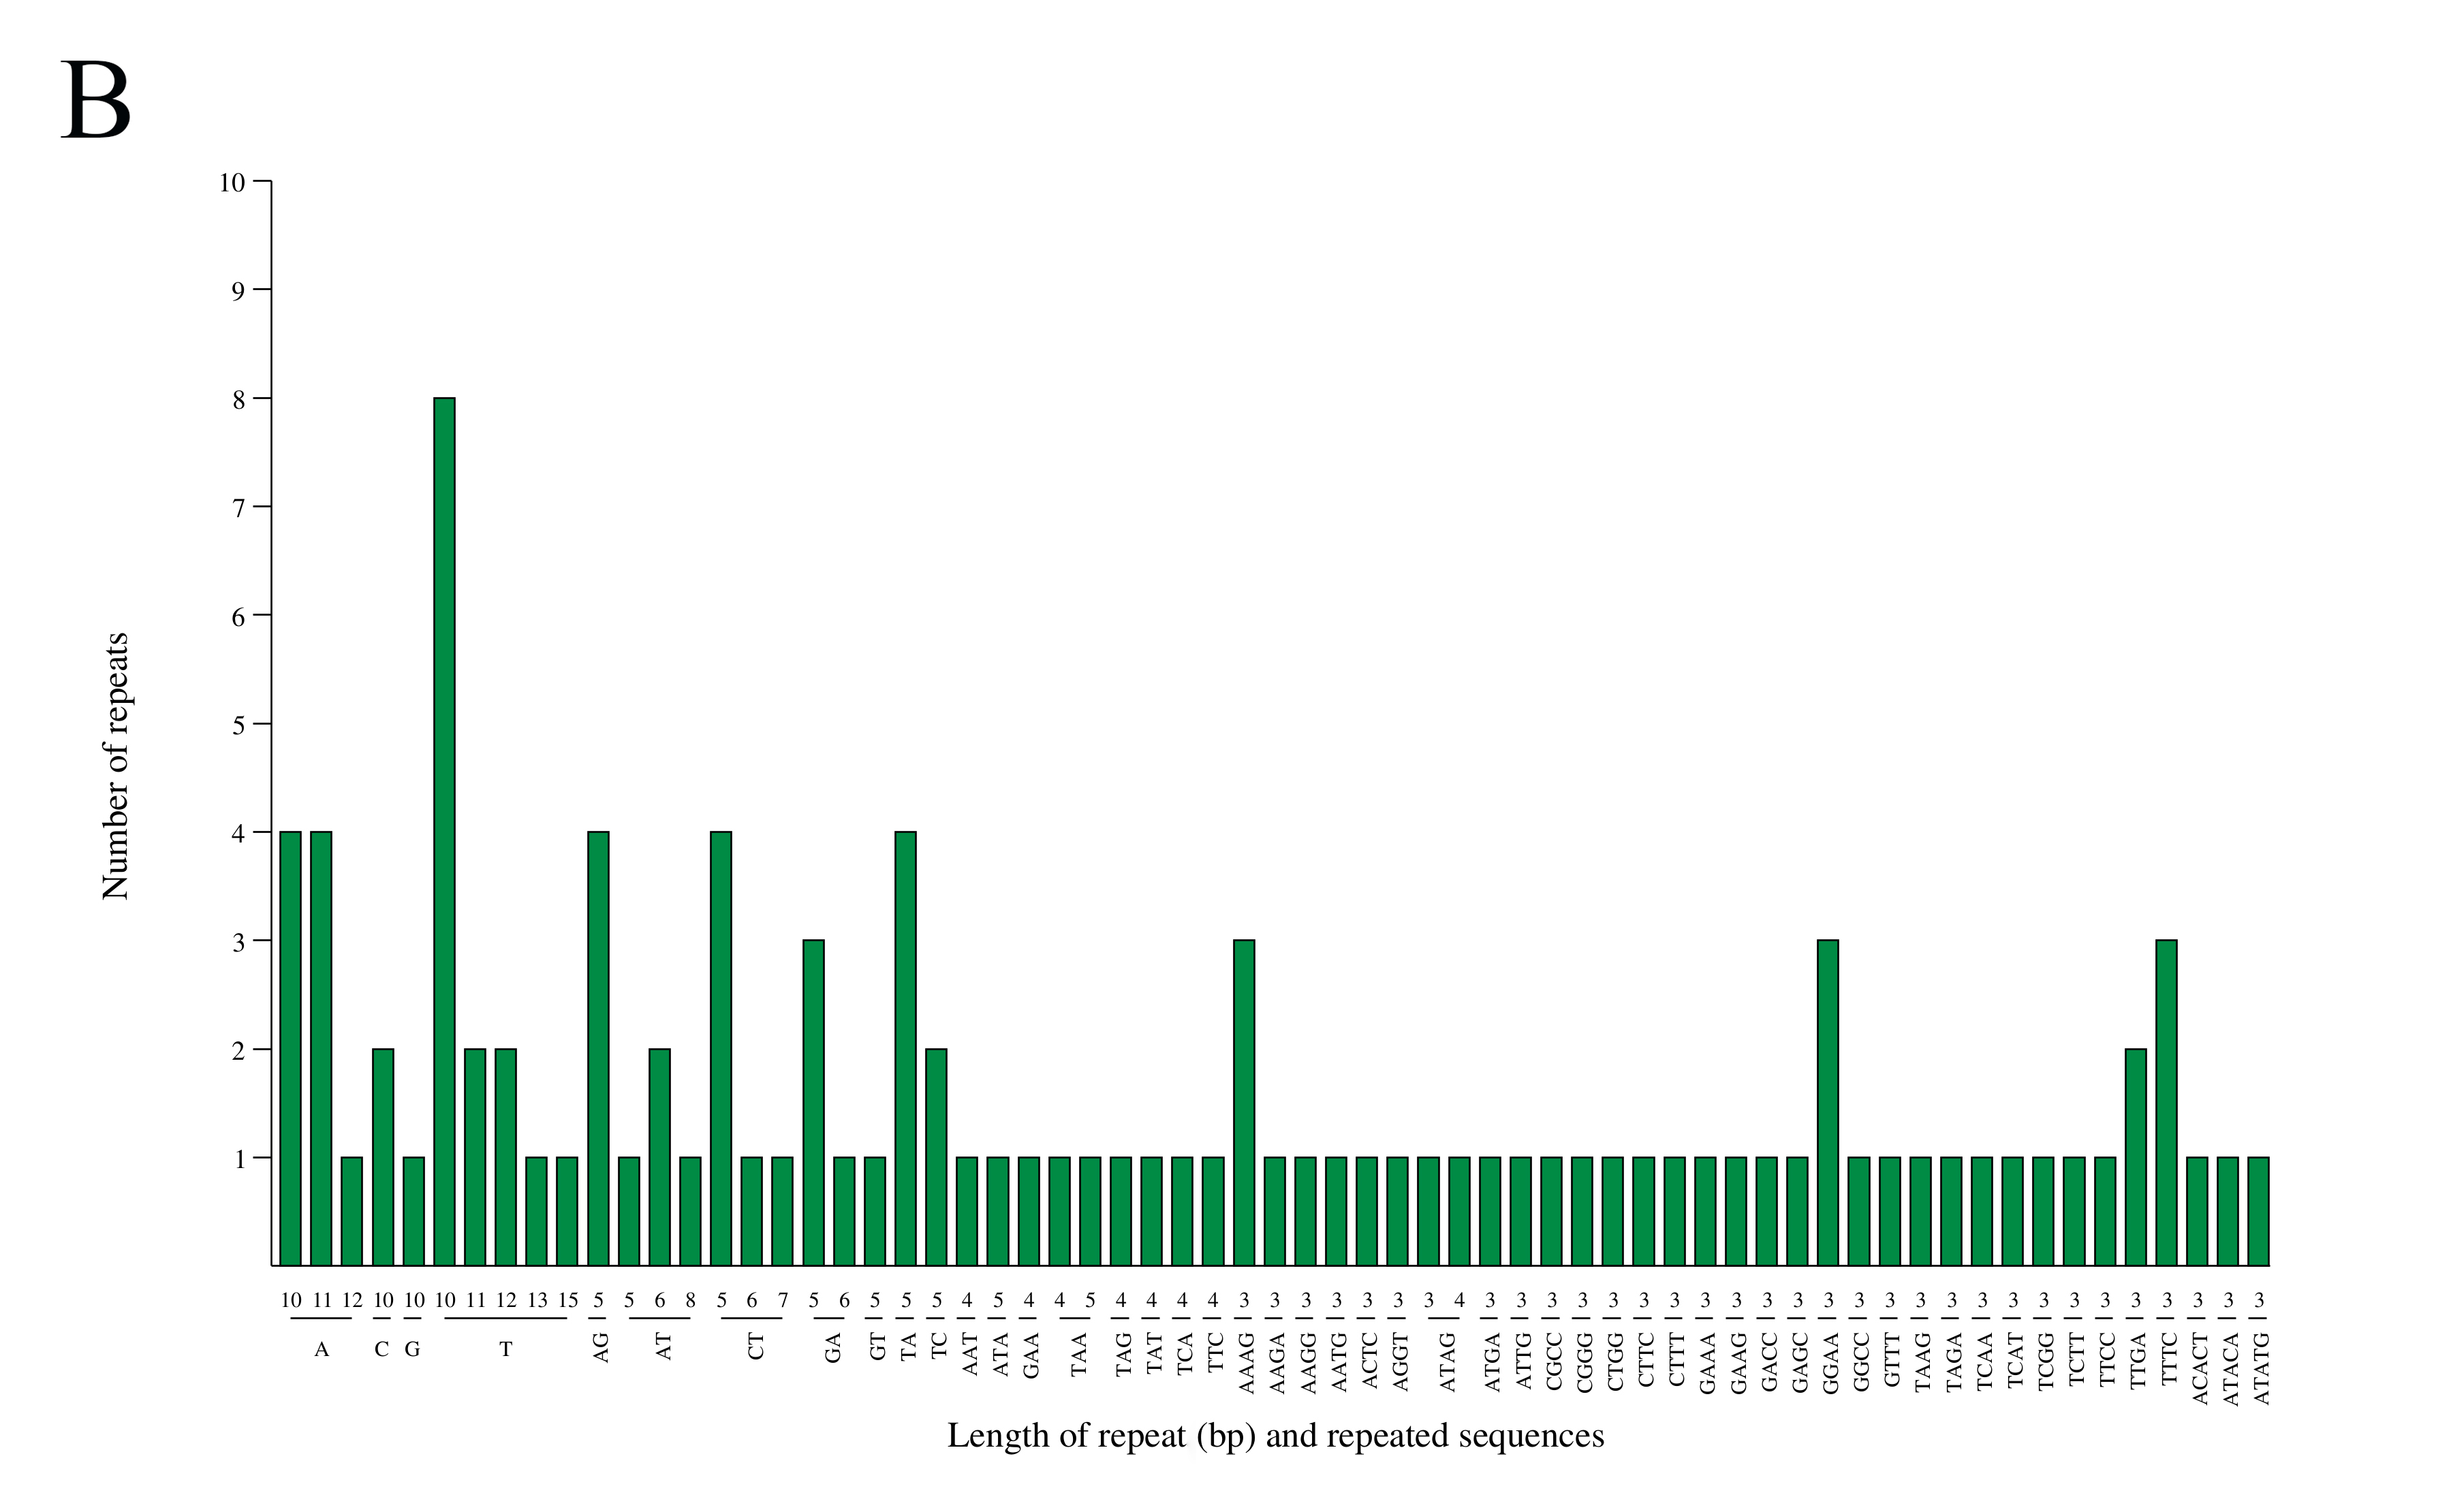
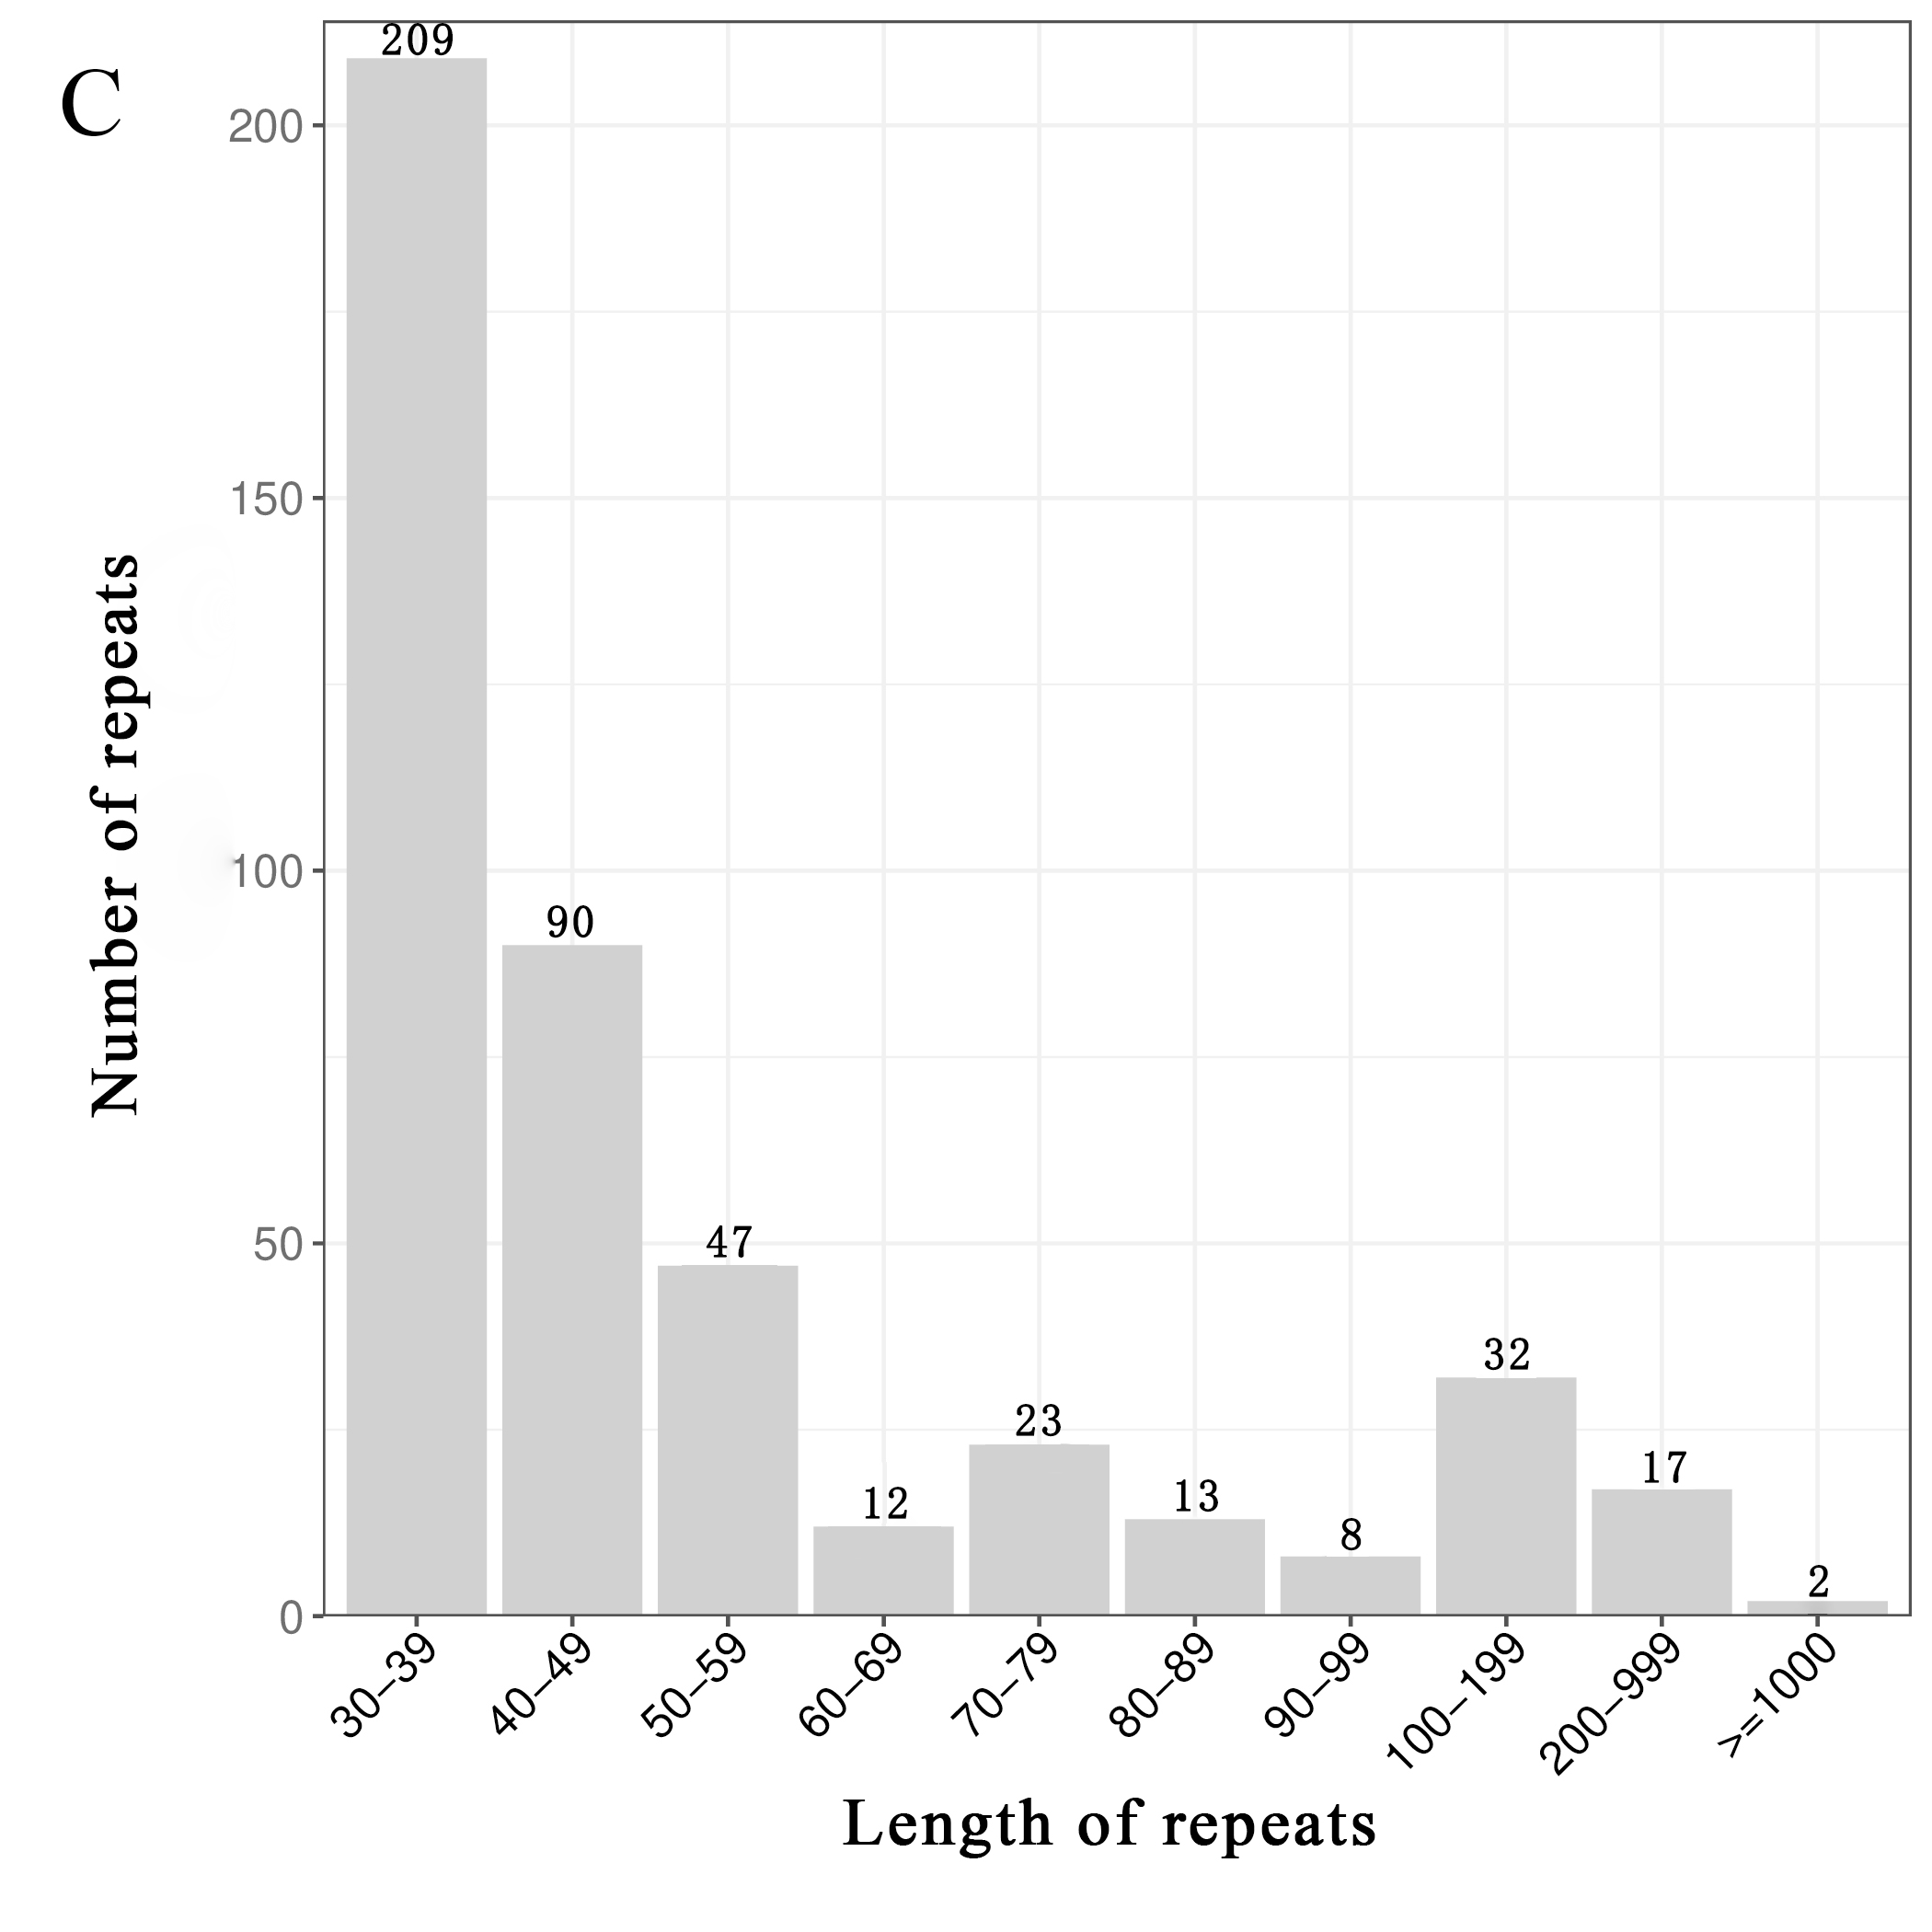
Table 4
Distribution of tandem repeats in the mt genome of L. barbarum.
. Analysis of sequence transfer in the L. barbarum mt genome
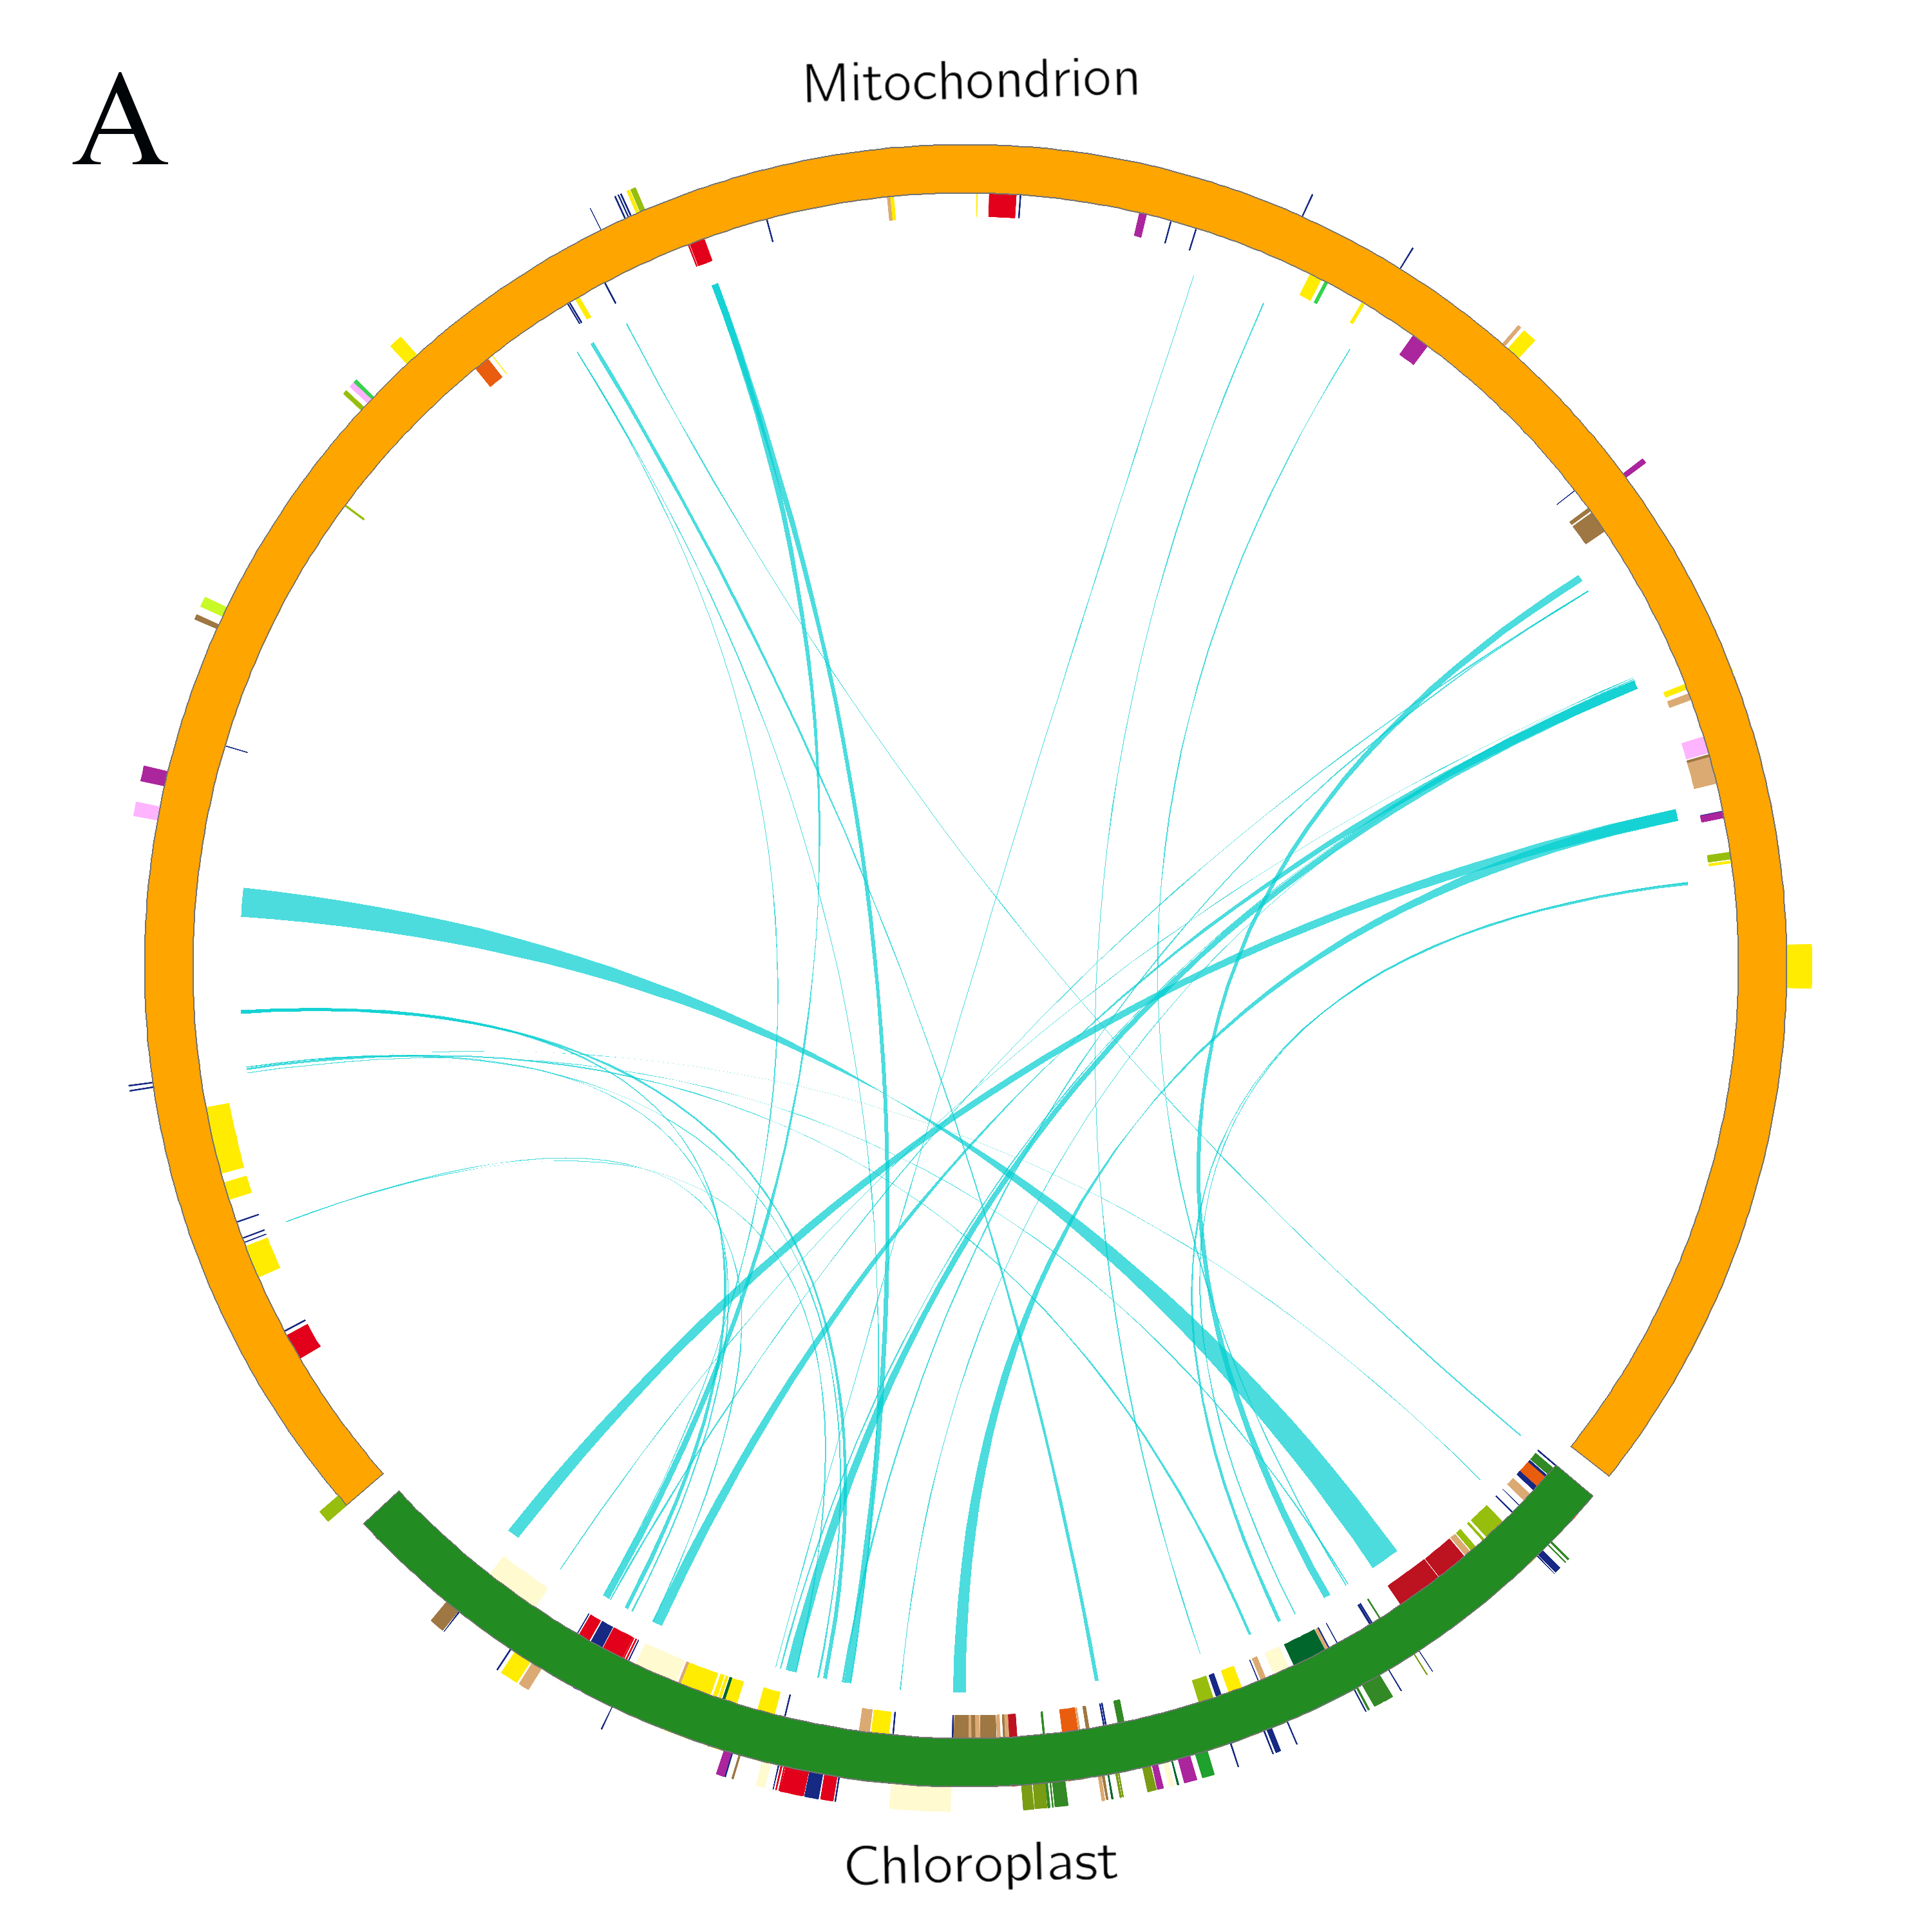
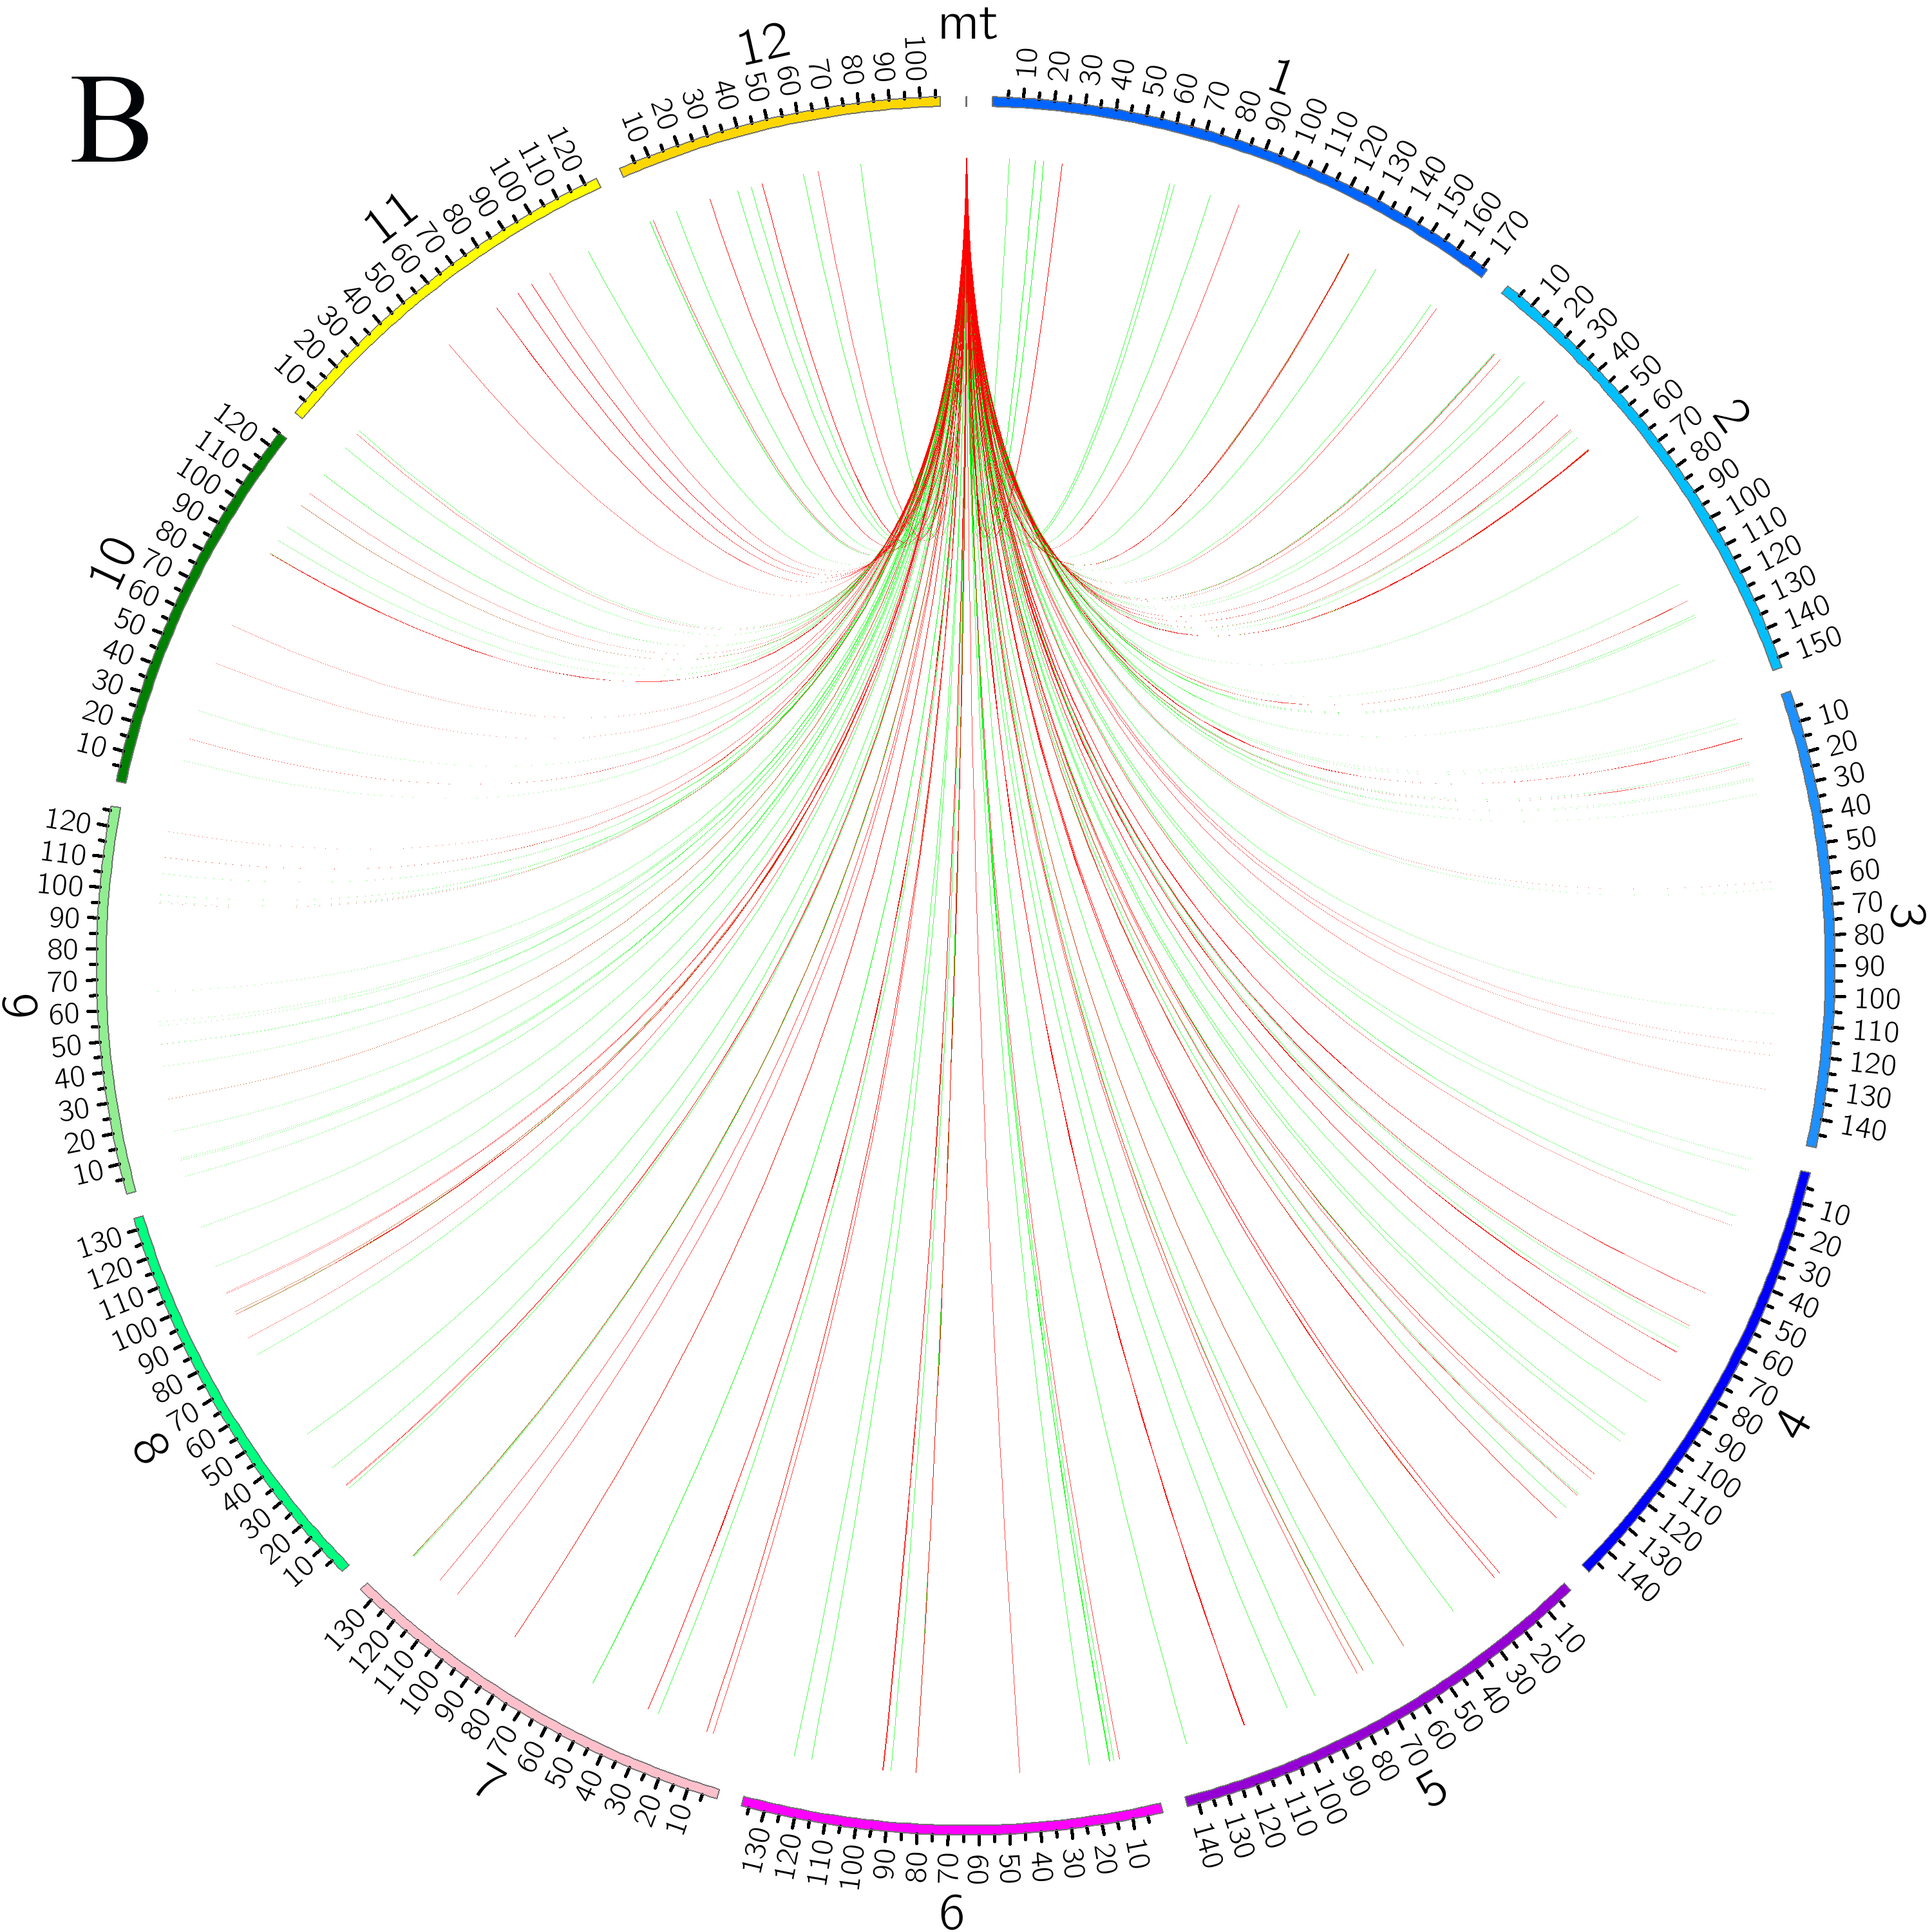
Blast alignment revealed that 31 fragments with a total length of 16.46 kb, accounting for 3.98% of the mt genome, were transferred from the chloroplast genome to mt genome of L. barbarum (Figure 4A). Overall, 10 complete genes were annotated in these fragments, including eight trn genes (trnI-CAU, trnW-CCA, trnP-UGG, trnS-GGA, trnD-GUC, trnN-GUU, trnH-GUG, and trnM-CAU) and two protein-coding genes (rpl23 and rpoB). In addition, some incomplete chloroplast genes with partial sequences were transferred (rpl2, rrn16, rrn23, rpoC1, ycf1, ndhF, trnE-UUC, psaA, psaB, psbC, psbD, ycf15, and trnS-GCU) (Table S2). Similarly, by aligning the mt genome with the 12 chromosomes of the nuclear genome, it was observed that sequence transfer also exists between them. As annotation information of the nuclear genome of L. barbarum is not available yet, only those sequence fragments with an alignment length of >500 bp between the mt genome and each chromosome were considered (Figure 4B). It can be preliminarily inferred that most of the lost genes in the mt genome of L. barbarum may have been transferred into the nuclear genome and became codon genes or pseudogenes.
Figure 4
Genetic fragments transferred in L. barbarum; (A) Chloroplast genome to mt genome; the blocks located in the outer and inner circles represent genes on the positive and negative strands, respectively. Blocks with the same color represent genes from the same complex or type. The interlink represents the homologous sequence; (B) Nuclear genome to mt genome; the green line represents homologous sequences of length ≥500 and <1,000 bp. Red line represents homologous sequences of length ≥1,000 bp.
. Analysis of RNA-editing site
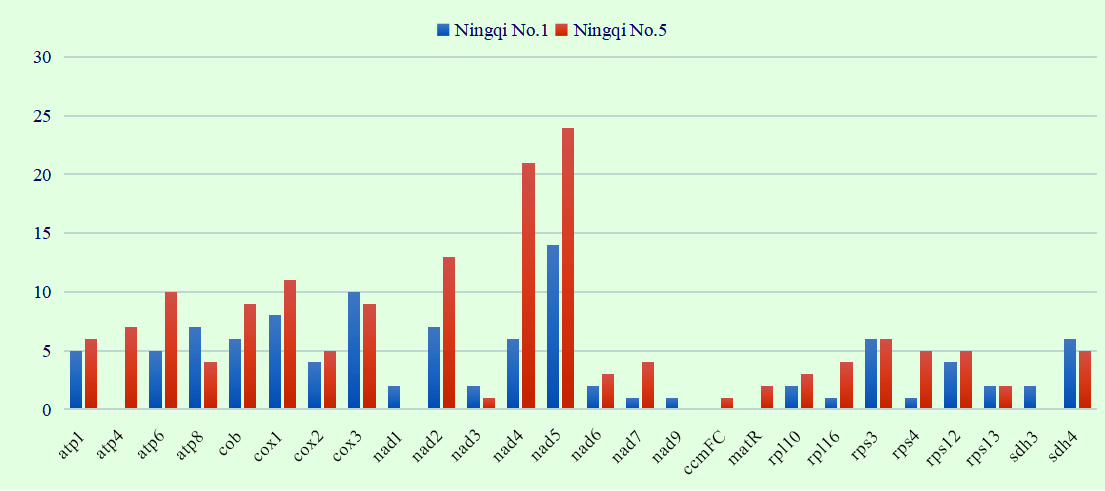
RNA-editing site alignment search was performed in combination with transcriptome data. The results revealed that although the mt genomes of “Ningqi No.1” and “Ningqi No.5” are identical in sequence, clear differences existed in their RNA-editing sites. In total, 104 RNA-editing sites were present in 23 genes of “Ningqi No.1,” and 160 RNA-editing sites were present in 23 genes of “Ningqi No.5.” Compared with “Ningqi No.1,” the number of RNA-editing sites contained in atp6, nad2, nad4, nad5, nad7, rpl16, and rps4 genes of “Ningqi No.5” was significantly high. RNA editing action of atp4, ccmFC, and matR was only observed in “Ningqi No.5,” and that of nad1, nad9, and sdh3 was only observed in “Ningqi No.1” (Figure 5). In addition, differences in the positions of RNA-editing sites were observed in “Ningqi No.1” and “Ningqi No.5.” Overall, 34 (32.7%) and 45 (28%) RNA-editing sites were observed in the first, 61 (58.7%) and 109 (68.1%) in the second, and nine (0.09%) and 6 (0.04%) in the third codon positions, respectively. An amino acid in atp8 was altered by RNA editing, making threonine convert to a stop codon in “Ningqi No.1.” The same situation occurred in atp6 and rpl16, making glutamine getting converted to a stop codon in “Ningqi No.5” (Table S3).
. Phylogenetic analysis
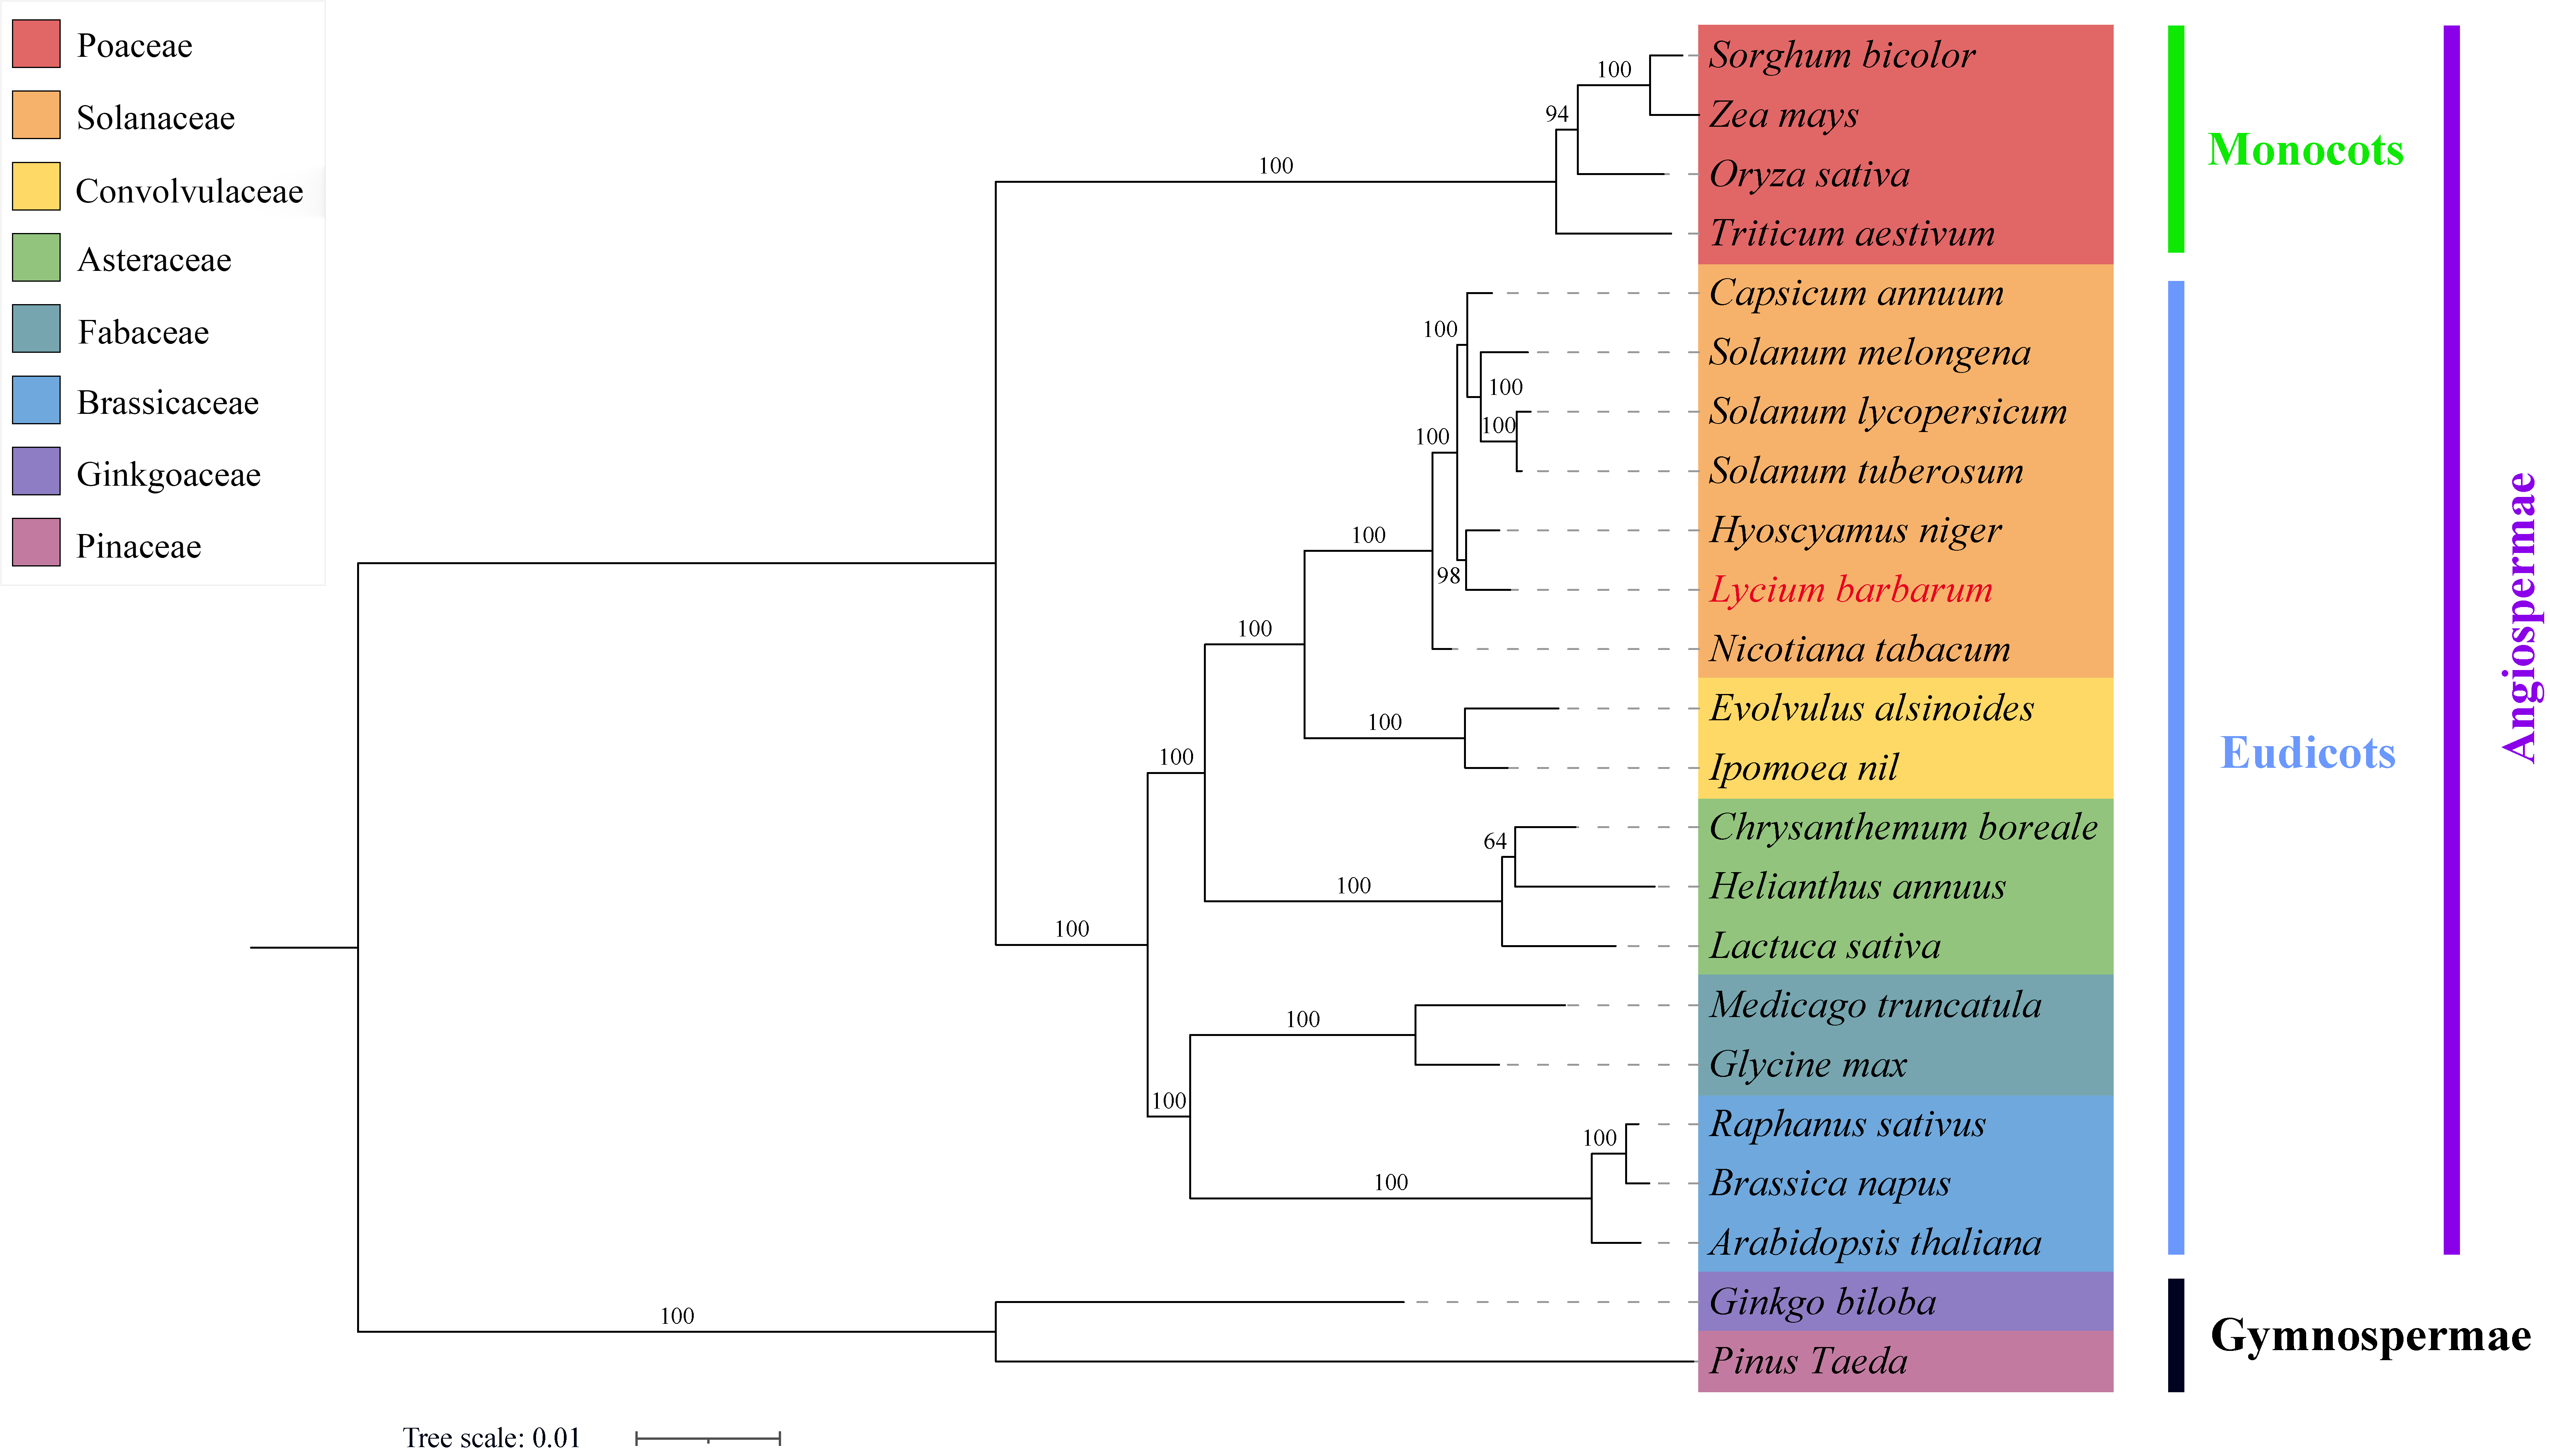
A total of 23 representative plants were selected to construct a phylogenetic tree. With gymnosperms as the outgroup, the plants belonging to Solanaceae, Poaceae, Convolvulaceae, Asteraceae, Fabaceae, and Brassicaceae families were clustered well on the corresponding branches, which is consistent with APG IV classification result (Chase et al., 2016). Further analysis revealed that L. barbarum and H. niger were located in the same evolutionary branch, indicating a closer evolutionary relationship between them. S. tuberosum, S. lycopersicum, S. melongena, and C. annuum were in the same larger branch. Among them, S. tuberosum and C. annuum had a closer evolutionary relationship; N. tabacum had the farthest genetic relationship with other plants from the Solanaceae family (Figure 6). The above results confirmed that mt PCGs can also be used as molecular markers to study phylogenetic relationships and genetic structure in plant species.
Figure 6
The phylogenetic relationships of L. barbarum with other plant species. A maximum-likelihood phylogenetic tree was constructed based on the sequences of 29 conserved PCGs. Ginkgo biloba and Pinus taeda served as the outgroups. The numbers on each node are bootstrap support values. Distinct colors indicate the families to which a specific species belongs.
. Discussion
With the development of sequencing technology, mt genomes of plants are being sequenced and assembled. Earlier, most of the mt genomes of plants were sequenced using next-generation sequencing (NGS) technology (McCombie et al., 2019). In NGS, only short sequences can be read, and long repetitive sequences are difficult to be identified. Thus, the accuracy and integrity of the assembled sequencing result are hampered (Kuang & Yu, 2019; McCombie et al., 2019). In recent years, the third-generation sequencing technology [single-molecule sequencing by Pacific Biosciences (PacBio) and Oxford Nanopore] has been rapidly developed, with the reading length increasing up to 100 kb (Dorado et al., 2021; Karin et al., 2023). The combination of second- and third-generation sequencing technologies would provide a higher-quality mt genome assembly. In this study, mt genomes of “Ningqi No.1” (fertile line) and “Ningqi No.5” (male sterile line) were assembled for the first time using Illumina xten (second-generation) and Nanopore ONT (third-generation) platforms. After assembly, “Ningqi No.1” and “Ningqi No.5” exhibited an identical mt genome sequence information. “Ningqi No.5” is a natural male-sterile mutant of “Ningqi No.1.” Its parent tree (YX-1) was found in the plantation of “Ningqi No.1” in 1999 (Qin et al., 2006). “Ningqi No.5” exhibits normal growth and floral organ shape; however, its stamen is shorter, and the pistil style is longer, which can only be cross-pollinated. Its anthers develop normally but function abnormally because no pollen is dispersed (Shi et al., 2018). It is reported that male sterility could be classified into CMS and genic male sterility (GMS) (Zhu et al., 2020). Generally, CMS involves structural rearrangement of mtDNA and uncoordinated inheritance between the mt and nuclear genomes, whereas GMS is caused by only nuclear genes (Bohra et al., 2016; Nie et al., 2023). The mt genome of “Ningqi No.5” revealed the same structural information as that of “Ningqi No.1.” It could be inferred that the occurrence of male sterility of “Ningqi No.5” is not directly related to CMS but to GMS.
The analysis of RNA-editing sites revealed clear differences between “Ningqi No.5” and “Ningqi No.1” in terms of editing site number and location. RNA-editing in mt genes is usually regulated by nuclear-encoded PPR proteins, which are mostly located in the mitochondria or chloroplasts. PPR proteins can edit and modify the RNAs transcribed from organelles, playing an important role in the biological function of mitochondria (Rovira & Smith, 2019). Studies have reported that deletion or mutation of PPR proteins can lead to protein misfolding and changes in editing efficiency, thus affecting the transcription process and causing incorrect expression of mt genes; this results in the undergrowth of plants and male sterility (Andrés-Colás et al., 2017; Lee et al., 2017; Qi et al., 2017). The transcriptome data from our previous experiments revealed that some PPR proteins expressed differently in “Ningqi No.1” and “Ningqi No.5” (Guan et al., 2020). It was preliminarily inferred that the differential RNA-editing in the mt genes of L. barbarum is related to the regulation of PPR proteins. This may cause changes in the protein structure and physicochemical properties and finally affect the normal biological function of the mitochondria of “Ningqi No.5.” However, this phenomenon should be verified by subsequent experiments.
Gene loss occurs during the differentiation of higher and lower plants, as well as monocots and dicots, and between different classes and genera. The gene loss varies greatly, even among the same family and genus (Zardoya, 2020). In normal cases, the genes encoding cytochrome C synthase and ribosomal protein are lost, whereas the complex I–V subunit genes are relatively conservative (Kelly, 2021; Zardoya, 2020). The mt genomes of angiosperms usually have a complete set of rRNA genes but incomplete trn genes, in which trnA, R, L, T, and V genes are usually missing (Michaud et al., 2011). In the complex I–V of L. barbarummt genome, only the sdh2 gene of complex II is lost. This gene was considered to be absent in the earliest evolutionary process of all plants. The cytochrome C synthase genes, ribosome subunit genes, and the tRNA genes of L. barbarum mt genome are lost in various degrees. It is generally believed that the occurrence of gene loss is associated with gene functions and evolution. Some lost mt genes are transferred into the nuclear genome, where they become coding genes or pseudogenes during the evolution process, and the lost tRNA genes are generally imported from the cytoplasm or nucleus (Sloan et al., 2023). Based on this, phylogenetic analysis performed using conservative core genes and some variable genes of the mt genome of plants can also be used to better reflect the evolutionary relationship among various species. For example, the phylogenetic analysis based on 29 mt PCGs in this study revealed that L. barbarum and H. niger are the closest related species. According to previous studies, the members of L. barbarum subtribe were once classified into the Solanum tribe together with the H. niger subtribe based on their external morphology (Von, 1895). Most members of H. niger subtribe are herbaceous plants, which further confirms that ligneous L. barbarum evolved from herbaceous plants (Cao et al., 2021).
Short repeats (<60 bp) are present in a high proportion (accounting for 76%) in the mt genome of L. barbarum. Generally, short repeats have low recombination frequency, and they may mediate irreversible recombination of the mt genome and can easily produce new repeats or missing original sequences. This leads to inheritable changes in the mt genome structure and plays an important role in species evolution (Maréchal & Brisson, 2010). Long repeats often have high recombination frequency, may mediate reversible recombination, and regulate molecular conformation of mt genomes and diversify its structure; this results in continuous expansion and complexity of mt genomes in higher plants (Arrieta-Montiel & Mackenzie, 2011; Gualberto & Newton, 2017). It is reported that high-frequency recombination within mtDNA molecules mediated by repeat sequences is generally because of an effective DNA repair system existing in the mitochondria. This system is double-strand break repair (DSBR), which is widely used in the plant mt genome to avoid the mutation of essential mt genes (Christensen, 2014; Wynn & Christensen, 2019). Moreover, studies have reported that DSBR is related to drought resistance in plants, as it can effectively repair DNA damages mediated by drought stress (Paszkiewicz et al., 2017). L. barbarum is characterized by strong tolerance to drought and saline–alkaline stresses and can grow on barren lands. Therefore, it was deduced that in the long-term evolution, the distribution of repeat sequences in the mt genome of L. barbarum may be associated with its adaption to the external environment.
. Supplementary material
The following supplementary material is available for this article:
Figure S1. Open reading frame (ORF) location in the mt genome of L. barbarum.
Table S1. GenBank accessions of mitochondrial (mt) genomes of 23 plants used for the phylogenetic analysis.
Table S2. Fragments transferred from the chloroplast genome to the mt genome in L. barbarum.
Table S3. RNA-editing sites in the mt genome of L. barbarum.
