. Introduction
The vegetation boundary that divides closed forests and nonforest in the high mountain area is referred to as the timberline or treeline (Korner & Paulsen, 2004). Above this line, forest life forms disappear and are replaced by the elfin wood belt, alpine meadow, or other high mountain scenery (Troll, 1973). Timberline elevation is related to climatic factors, topography, and even anthropogenic activities (Holtmeier, 2009). Among these factors, climatic factors, including warm-season temperatures, are deterministic factors and play a vital role in tree growth and survival in the mountains (Korner & Paulsen, 2004; Paulsen & Korner, 2014). Knowing the altitudinal distribution of timberline and climate factors is necessary because it could help to predict timberline elevation in the mountains (Cogbill et al., 1997).
Several studies have been conducted to develop models to decipher timberline in different regions, i.e., Ural (Malyshev, 1993), Appalachian Mountains (Cogbill et al., 1997), East Asia (Fang, 1995), and global mountains (Korner & Paulsen, 2004). Indeed, these studies define our understanding of timberline. However, previous study methods do not apply to other regions. For example, the altitude of the timberline in the Ural region is 2,950 m (Malyshev, 1993). However, timberline usually occurs at more than 3,500 m in the Tibetan Plateau (Schickhoff, 2005).
Heat deficiency is a major deterministic factor that defines altitudinal polar timberline (Holtmeier, 2009; Korner & Paulsen, 2004). Accordingly, isotherms have been proposed to predict timberline elevation. The most widely used thermal indexes are the warmest month air temperature of 10 °C (Ohsawa, 1990), Holdridge’s annual temperature of 3 °C, and Kira’s warmth indices (WI) of 15 °C (Fang & Yoda, 1989; Holdridge, 1947). However, these indices may have an extensive range at timberline sites in different mountain regions. For instance, the warmest month’s mean temperature ranged from 6–7 °C in the Southern Andes to 13 °C in the Appalachian Mountains (Cogbill & White, 1991). Additionally, the seasonal mean ground temperature varied from 5.6 °C in tropical regions to 10.5 °C near the Mediterranean region (Korner & Paulsen, 2004). Moreover, the upward or downward shift of the timberline rarely occurs in parallel to the change in any isotherm (Holtmeier & Broll, 2005). Therefore, it is not appropriate to use a specific type of isotherm to explain the timberline elevation on a global scale.
Mountain areas contain variations in environmental factors, and the complexities of thermal conditions are due to rugged topography and the heating effect of high-elevation surfaces (Elsen et al., 2020; Sun & Zhang, 2016). The altitudinal variability of timberline is correlated with summer–winter temperatures (Kullman, 2007), continental climate (Schickhoff, 2005), and precipitation (Devi et al., 2020). Prolonged or reduced snow cover and growing season positively correlate with a tree line at the global and regional scale (Gansert, 2004).
The temporal shift of treelines in elevation is mainly due to the combined effect of multivariable variations (Leonelli et al., 2011; Mayor et al., 2017). Nevertheless, some studies have focused on temperature as the common driver to determine treeline variability. Regional studies have focused primarily on regional specificity and ignored generality. This approach has led to seemingly conflicting conclusions. Therefore, future studies must address multiscale analysis to eliminate the limitations of scale based on cross-scale hypotheses (Malanson et al., 2011). To bridge these two approaches, we hypothesized that the common drivers controlling the variability of timberline altitude are multiple climatic variables rather than a single one on the broad (global and continental) scale. Our goal was to develop a multivariate model to understand the altitudinal distribution of the alpine timberline. The second aim was to check the application of the model. Multivariate regression models have been implemented in the past to decipher the impact of climate factors on timberline (He et al., 2020; Pandey et al., 2018; Weisberg et al., 2013). We developed a multivariate regression model to explain the altitudinal distribution of timberlines on the Eurasian continent, taking into account the application of regression models in timberline prediction.
. Material and Methods
Timberlines used in this paper were defined as the upper limit of mountain forest belts based on mountain altitudinal belts, and most of them were collected based on altitudinal belt data in mountain geography research. The timberline is defined as a boundary between continuous forest and shrub belt or grassland. Continuous forests are distributed below the timberline, and shrub belt or grassland exists above the timberline. Based on this definition, we collected a data set of timberline sites with elevation and geographic coordinates (latitude, longitude) from published literature. If authors did not explicitly state altitudinal belts, but only described forest community, including tree height, tree species, etc., in previous studies, the upper limit of closed forest with groups of trees at least 3 m height were also obtained to cover as many mountains as possible. All the necessary timberline source data have been mentioned (Appendix S1).
We reduced errors in the data according to the following criteria: (i) the timberline should be more than 200 m below the summit to minimize local climatic effects near the summit (Barry, 1992); (ii) when more than one author described a timberline site at different elevations, timberline elevations around the sites were averaged; (iii) if there was a significant difference in timberline elevation between sunny and shady slope or between windward and leeward slopes, as in the Himalayas (Schickhoff, 2005), we considered the timberline elevation for different slopes separately. To reduce the impact of human anthropogenic activity on timberline height, we discarded the data whose elevations were explicitly stated to be depressed by human disturbance, fire, natural disasters, etc., according to literature descriptions.
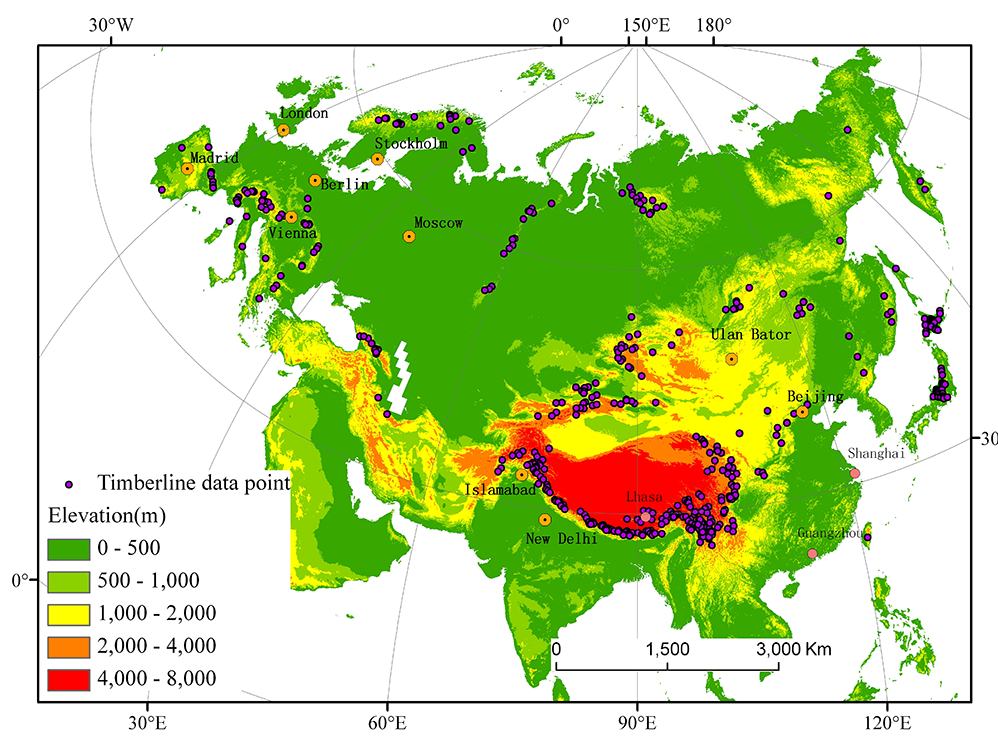
We compiled a total of 473 timberline data points. Our data set covered almost all the mountains and plateaus in which natural timberlines were explicitly described in Eurasia (Figure 1). For each data site, geographic coordinates (latitude, longitude) were also collected from the literature. Maps were adjusted to the altitude of the timberline according to topographical data from Shuttle Radar Topography Mission (SRTM) 90-m digital elevation data (https://srtm.csi.cgiar.org/) and timberline elevation values.
Monthly mean temperature and annual precipitation at the altitude of timberline were extracted from the WorldClim-global climate data set (Hijmans et al., 2005). Mean temperature and precipitation data extracted from WorldClim were in line with data and conclusions drawn in previous research. For example, the July mean temperature of the arctic boundary of Taiga extracted from WorldClim is 11.7 °C, very close to the research value of 11.2 °C (Malyshev, 1993). The mean temperature of the warmest month at the timberline in the Alps extracted from WorldClim was 10.15 °C, very close to the commonly adopted 10 °C (Holtmeier, 2009).
Monthly mean temperatures extracted from WorldClim represent the spatial average value of grid squares at the altitude of timberline. They can be adjusted to timberline elevation using a mean lapse rate of 0.6 °C/100 m (Barry, 1992). Monthly mean temperature and annual precipitation data were averaged from 1950 to 2000 to represent actual climatic conditions. Annual mean temperature (AMT) and temperature annual range (ART) determine the altitudinal distribution of timberlines in the extratropical mountain ranges of the world (Jobbagy & Jackson, 2000). The mean temperature of the warmest month (MTWM) and mean temperature of the coldest month (MTCM) were calculated as the maximum and minimum values of the monthly mean temperatures. Annual precipitation and moist conditions had a positive correlation with physiognomic variety, species density, and altitudinal shifts of the timberline (Gillespie et al., 2006). Moisture and precipitation play a vital role in determining the treeline distribution. Therefore, we used the potential evapotranspiration ratio (PER), annual actual evapotranspiration (AET), and Ellenberg quotient (EQ). In areas with few weather stations, such as the central Tibetan highlands, annual precipitation was modified by JAXA Global Rainfall Watch (http://sharaku.eorc.jaxa.jp/GSMaP_crest) data. Warmth index (WI) and annual bio-temperature (ABT) were used as proxies of growing season temperature. These were crucial factors controlling the treeline elevation distribution worldwide. The climatic variables that potentially account for timberline variability were compiled and calculated by formulae shown in Table 1.
Table 1
Descriptions, formulae, and references of the 12 climatic variables potentially influencing timberline elevation.
| Climate variable | Description | Formula | Reference |
|---|---|---|---|
| AMT | Annual mean temperature | (Hijmans et al., 2005) | |
| MTWM | Mean temperature of the warmest month | ||
| MTCM | Mean temperature of the coldest month | ||
| AP | Annual precipitation | ||
| ART | Temperature annual range | MTWM–MTCM | |
| WI | Warmth index | (Kira, 1991) | |
| CI | Coldness index | ||
| K | Continentality | (Gorczyński, 1920) | |
| ABT | Annual biotemperature | (Holdridge, 1947) | |
| PER | Potential evapotranspiration ratio | (Holdridge, 1947) | |
| AET | Annual actual evapotranspiration | (Turc, 1954) | |
| EQ | Ellenberg quotient and MTWT represents mean temperature of the warmest month | (Ellenberg, 1988) |
We identified the climate variables related to the distribution of timberline elevation (Table 1). Principal component analysis (PCA) in SPSS (version 18) software revealed significant climate variables. We examined the eigenvalues and proportion of cumulative variance for 12 climatic variables and extracted the first three or four principal components, which accounted for most of the variance of the climatic variables. Correlation of principal components and original climatic variables were given by loadings in placement along PCA axes by the component matrix, so variables with bigger loadings were generally considered more important for each principal component. Mean temperature of the warmest month, mean temperature of the coldest month, continentality, and annual precipitation had relatively greater impact on timberline distribution than did other variables. We performed a multiple regression analysis with these four climatic variables as independent variables and timberline elevation as dependent variables. We conducted analysis of variance (ANOVA), coefficient of determination (R2), and t test for the model.
. Results
. Impact of Climatic Factors on Timberline
Principal component analysis for the 12 climatic variables revealed that the first four main components accounted for approximately 97% of the overall variance in climatic variables. The first principal component highlighted mean temperature of the coldest month (MTCM), coldness index (CI), temperature annual range (ART), and annual mean temperature as significant factors in cold seasons. The second principal component emphasized the mean temperature of the warmest month (MTWM), warmth index, and annual bio-temperature in thermal conditions of the growing season. The third component showed annual precipitation (AP), actual annual evapotranspiration (AET), and potential evapotranspiration ratio (PER). These variables reflected the moisture condition to some degree. Continentality played a controlling role in the fourth component.
Figure 2
Mean temperature of the warmest month (A), mean temperature of the coldest month (B), continentality (C), and annual precipitation (D) at timberlines of the Eurasian continent.
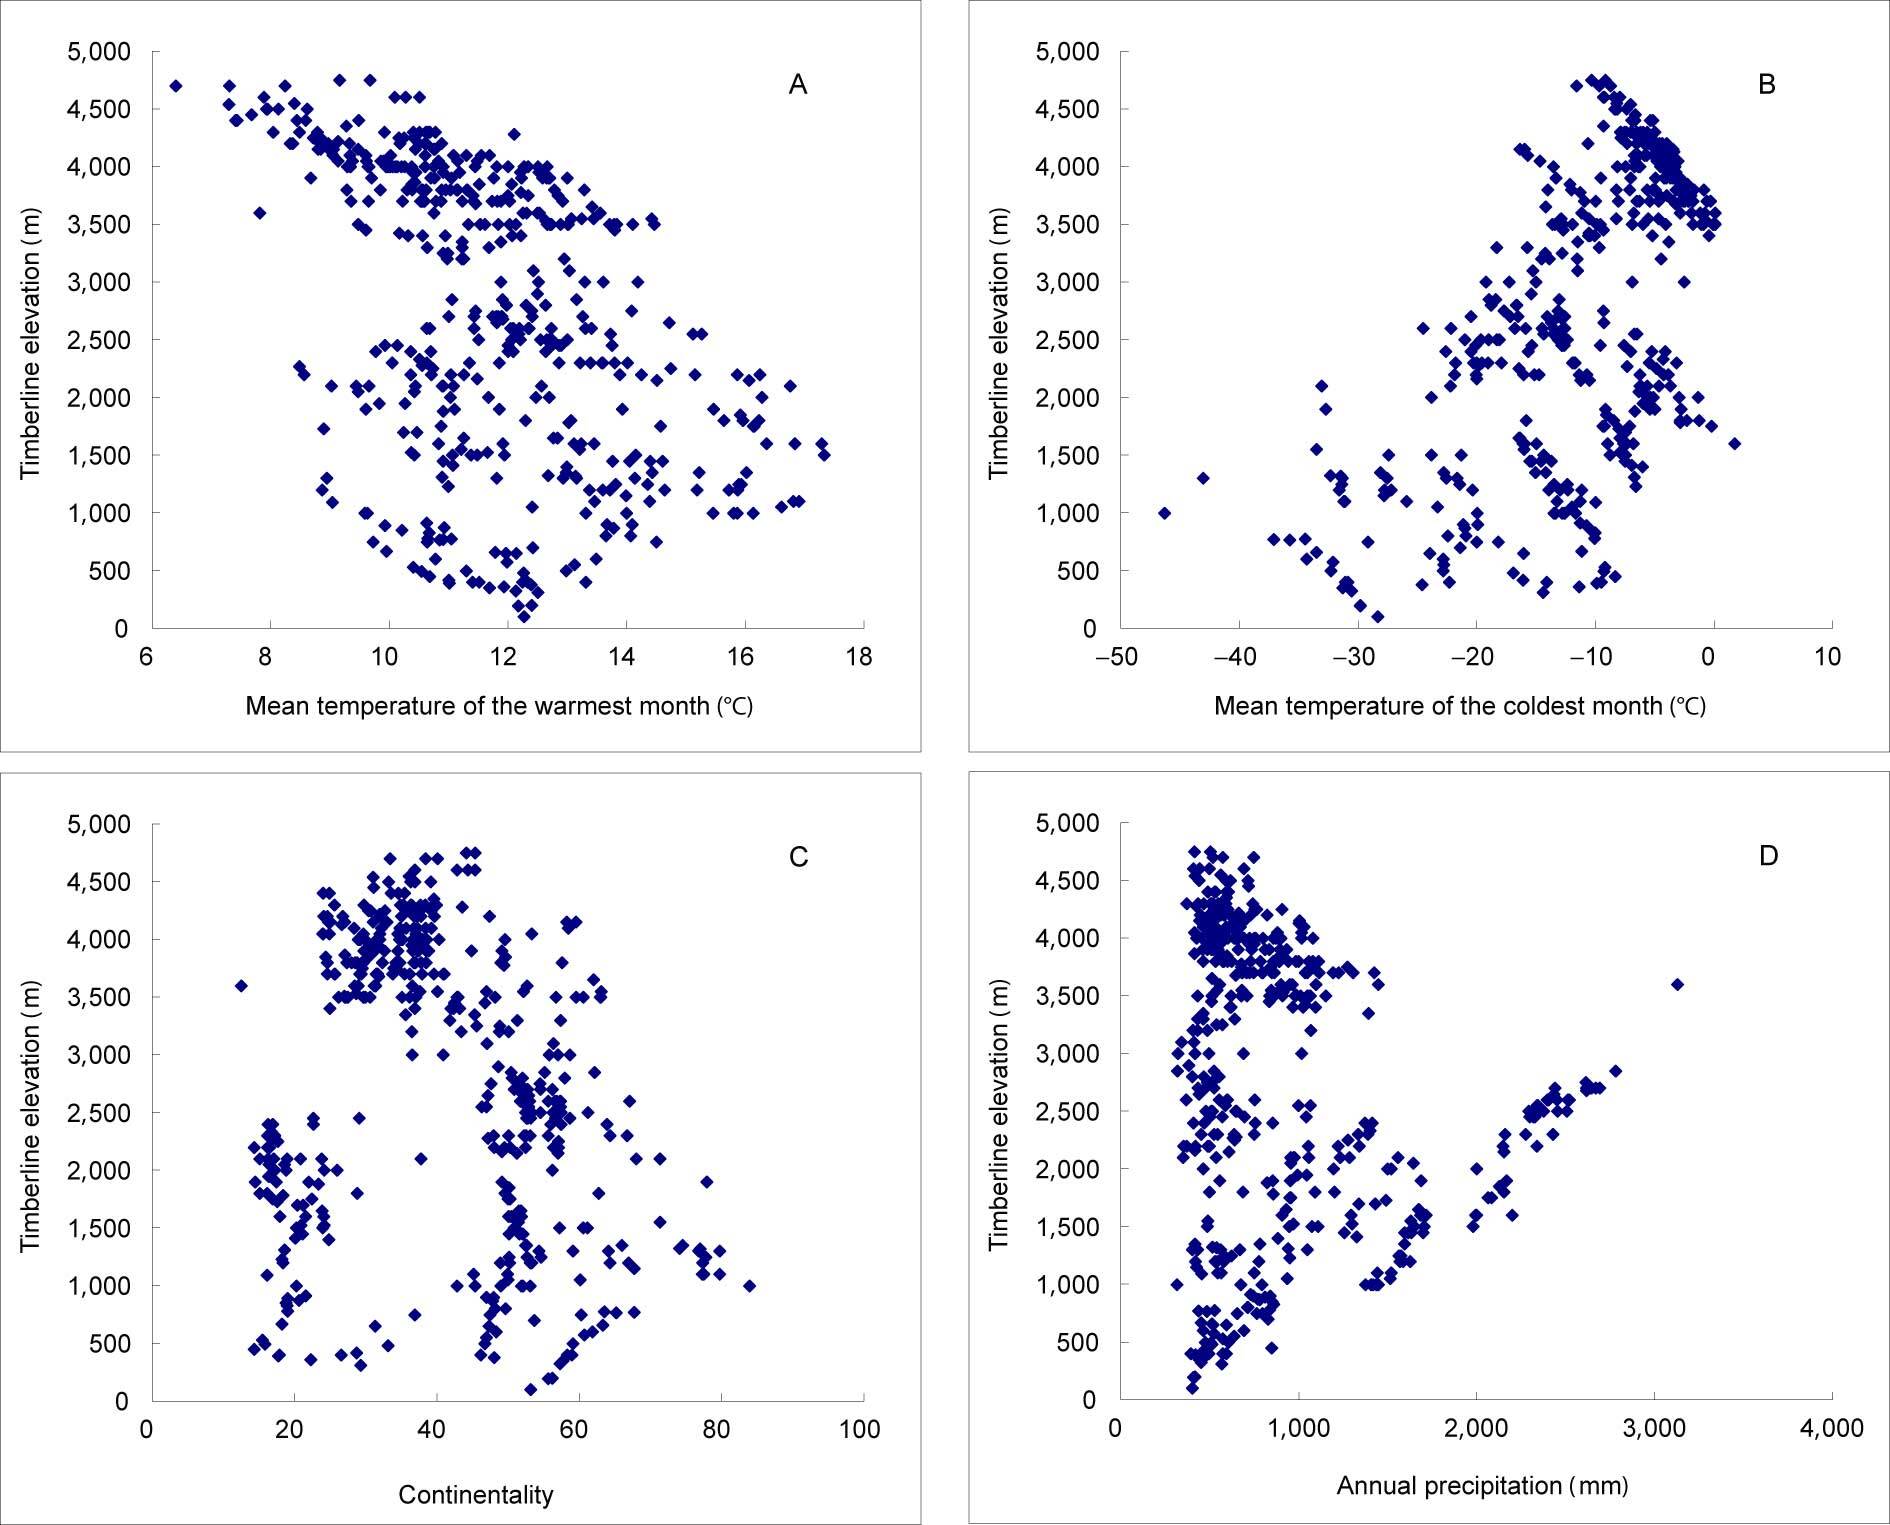
The warmest month mean temperature (MTWM) and annual precipitation (AP) did not significantly affect timberline altitude in Eurasia. The coldest month mean temperature (MTCM) showed a weak positive correlation with timberline altitude (Figure 2). Furthermore, these factors have a wide range at timberline elevation (e.g., MTWM from 6.4 °C to 17.3 °C, MTCM from −46.3 °C to 1.8 °C, continentality from 12.5 to 83.9, and AP from 316 mm to 3,129 mm across the Eurasian continent) (Table 2). Based on these four variables (MTWM, MTCM, K, and AP), we developed a multiple linear regression model that explains 95% of timberline elevation distribution on the Eurasian continent (Table 3). Exclusion of the fourth factor, i.e., annual precipitation, did not affect the results, and the model could still explain 91% of the variability of timberline distribution (p < 0.0001). Multiple linear equations explained the impact of climate variables on timber elevation in eastern and western parts of Eurasia (Table 4). T test of the regression coefficients also demonstrated that the four climatic variables have significant correlations with the altitudinal distribution of timberline. The multiple linear regression model slope revealed that MTCM and continentality were approximately equivalent to 226 m and 104 m in the rise of timberline elevation, respectively. On the contrary, timberline elevation declined at an average rate of 413 m for a 1 °C increase in MTWM and 46 m for a 100-mm increase in AP (Table 3). MTCM contributed the most to timberline elevation variability (41.28%), followed by continentality (34.9%), MTWM (18%), and AP (5.82%).
Table 2
Descriptive statistics of the climatic variables controlling timberline variation at the position of timberline sites in Eurasia.
| Variable | Range | Minimum | Maximum | Mean | SD |
|---|---|---|---|---|---|
| Timberline elevation (m) | 4,650 | 100 | 4,750 | 2,744 | 1,242 |
| MTWM (°C) | 10.9 | 6.4 | 17.3 | 11.7 | 2.0 |
| MTCM (°C) | 48.1 | −46.3 | 1.8 | −11.1 | 8.2 |
| Continentality | 71.4 | 12.5 | 83.9 | 41.1 | 14.9 |
| AP (mm) | 2,813 | 316 | 3,129 | 923 | 571 |
Table 3
Multiple linear regression models summary for timberline elevation based on SPSS 25.
Table 4
Multiple linear regression models summary, ANOVA, regression coefficients, and significance for the timberline sites west and east of 70° E in Eurasia. Ninety-three sites and 380 site locations in western and eastern parts of Eurasia were included.
. Regional Difference in Contribution of Selected Variables to Timberline Elevation Distribution
T-test results demonstrated that MTWM, MTCM, continentality, and AP had pronounced effects on timberline variability. East of 70° E, MTCM was the primary controlling factor, with a contribution rate of 44%, followed by Continentality (28.86%). Meanwhile, west of 70° E, continentality and MTCM were almost equally important (contribution rates of 40.21% and 39.79%, respectively), followed by MTWM (17.71%) and AP (2.29%). At the position of the timberline, the range of MTCM was as large as 46.4 °C in the eastern continent, while this value was only 26.4 °C in the west (Table 5). This may explain the significant contribution of MTCM to timberline elevation in the east Eurasian continent. The relatively higher contribution of annual precipitation in the east is likely related to the intense variation of annual precipitation caused by the Asian monsoon. The range of annual precipitation was as large as 2,813 mm, while in the west, this value was only 1,850 mm (Table 5).
Table 5
Descriptive statistics of the four climatic variables at the altitude of timberline data sites in eastern and western parts of the Eurasian continent.
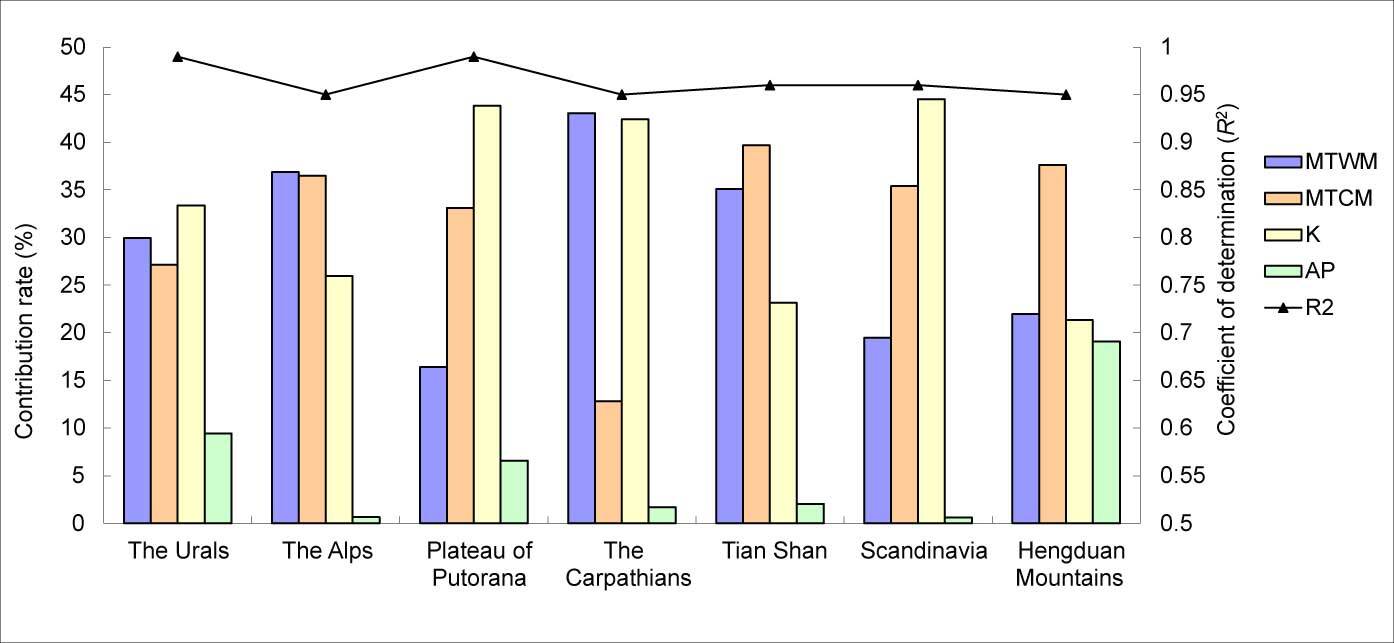
At the regional scale, our multivariable model also works well (Table 6), explaining 99% of timberline elevation in the Urals, 95% in the Alps, 99% in the Putorana Plateau, 95% in the Carpathians, 96% in the Tian Shan, 96% in Scandinavia, and 95% in the Hengduan Mountains (Figure 3, Table 6). Nevertheless, the contribution of these four climatic variables varies greatly among different mountain ranges. In the Urals, continentality contributes most to the altitudinal distribution of timberline, accounting for 33.36%, followed by MTWM (29.95%), MTCM (27.16%) and AP (9.44%). In the Alps, the contribution rate of MTWM, MTCM, continentality, and AP to timberline elevation distribution is 36.89%, 36.5%, 25.96%, and 0.65%, respectively. In the Putorana Plateau, the contribution rate of MTWM, MTCM, continentality, and AP is 16.43%, 33.13%, 43.83%, and 6.61%, respectively; 43.04%, 12.81%, 42.43%, and 1.72%, in the Carpathians; 35.12%, 39.69%, 23.16%, and 2.03% in Tian Shan; 19.47%, 35.41%, 44.53%, and 0.6%, in Scandinavia, and 21.98%, 37.61%, 21.33%, and 19.08% in the Hengduan Mountains.
Table 6
Multiple linear regression analysis for treelines in Ural, Alps, Putorana Plateau, Carpathian, Tian Shan, Scandinavian, and Hengduan Mountains.
Figure 3
The coefficient of determination (R2) of the multiple linear regression models and the contribution rates of MTWM (mean temperature of the warmest month), MTCM (mean temperature of the coldest month), K (continentality), and AP (annual precipitation) to timberline elevation in different mountains.
. Discussion and Conclusions
We showed that MTWM, MTCM, climatic continentality, and AP together determined altitudinal distribution of timberline in the Eurasian continent. The multiple linear regression model based on these four climatic factors can explain 95% of timberline elevation variability in the continent. Our results align with a previous study conducted on timberline elevation on a broad scale (Korner, 1998). However, the common driver is not a specific type of climatic factor. Instead, it is the combined effect of MTWM, MTCM, climatic continentality, and AP. These four variables reflect the impact of four different climatic conditions (cold, hot, dry, and wet) on forest growth and explain timberline elevation variability from four aspects: low temperature, growing season temperature, moisture condition, and continentality.
Our results indicated that MTCM and climatic continentality explained over 70% of the variation in altitudinal distribution of timberline in Eurasia (Table 3, Table 4). MTWM and annual precipitation (AP) contributed approximately 18% (p < 0.001) and 5.82% (p < 0.001) to timberline elevation in Eurasia, respectively (Table 3). These results indicate the significance of MTCM and climatic continentality in explaining the elevation variability of timberline in the Eurasian continent. This finding supports the notion of a higher sensitivity to winter warming relative to summer warming (Harsch et al., 2009). Physiologically, winter temperature is correlated significantly with winter desiccation and winter stress. The former has been generally considered the impeding factor for trees to survive in the cold and drought environment of the high mountains (Sakai & Weiser, 1973), and the latter (e.g., winter wind or heavy snowfall) can also induce mechanical damage (Hadley & Smith, 1986; Kjallgren & Kullman, 1998; Wardle, 1968). Warmer summer contributes to the completion of the growth of individual cells and walls of woody plants to withstand severe winter desiccation and promote optimum photosynthesis to compensate for the dry-matter loss in the winter cold (Korner, 2016). Some episodic events, such as summer frosts and summer drought, may cause fatal damage to buds and saplings at timberlines (Taschler et al., 2004; Wagner et al., 2021). In regions with plenty of rainfall, precipitation negatively affects tree growth by shortening the growing season or causing mechanical damage by snowpack (Gansert, 2004).
According to our model, the highest timberlines should occur in the continental regions with warmer and drier climates because the precipitation is sufficient to allow the development of closed forests. Such environments appear in the highest timberline date sites in the southeastern Tibetan plateau and Nevado Sajama in Bolivia (Hoch & Korner, 2005; Miehe et al., 2007). The lowest timberlines should occur in the regions with the lowest winter temperature, e.g., Moma and Bulun in Northern Siberia. In Moma and Bulun, MTCM at the timberline is as low as −30 °C, and the timberline elevation is lower than 200 m (Malyshev, 1993). MTCM is −11.3 °C at the timberline site at Tornetrask in northern Sweden, as high as in the Kaghan valley of the western Himalaya, but the Swedish timberline elevation is at 360 m (Hoch & Korner, 2003). Although our models explained over 95% of timberline elevation in the Eurasian continent, the residuals satisfy a normal distribution assumption. However, there are also some outliers, and they are present in some volcanic mountains. For example, the observed timberline elevation is at 600–800 m in the Kamchatka (Gorchakovsky & Shiyatov, 1978); our model predicted the timberline elevation there at 1,530 m. This depression of timberline elevation can be ascribed to the destruction of forests by volcanic eruptions a century ago; the nutrient-poor volcanic soil impeded the subsequent succession of forests (Grishin et al., 1996). Other timberline sites that differ significantly from our predictions are smaller mountains. These forests could not reach their climate timberline elevation. For example, our predicted timberline elevation was 1,780 m in Mt Rausudake on the northern coasts of Hokkaido in Japan, while the summit was only about 1,600 m. Those timberlines were commonly present near the summit and impacted by summit microclimate, such as strong wind (Wardle, 1977; Yoshino, 1978). They form a so-called “pseudo timberline,” described in previous studies (Gersmehl, 1973; Mark, 1958).
Timberline or treeline ecotone is commonly assumed to be sensitive to climate change. Our timberline data sites are derived from different times, neglecting the influence of changing climate on timberline variation to some extent. However, this should not provoke any problems, as it is understood that it takes more than 100 years for timberlines to advance upward under a warming climate, and the tree density was more sensitive to climate variability than the position shift (Camarero & Gutiérrez, 2004; Wang et al., 2006). We used the past 60 years of data. The dynamic fluctuation of timberline elevation at a temporal scale should be addressed in subsequent studies. Additionally, we did not differentiate tree species in exploring the expected correlation between timberline elevation and climate factors. Future studies should also focus on the altitudinal distribution of timberlines with different tree species.
